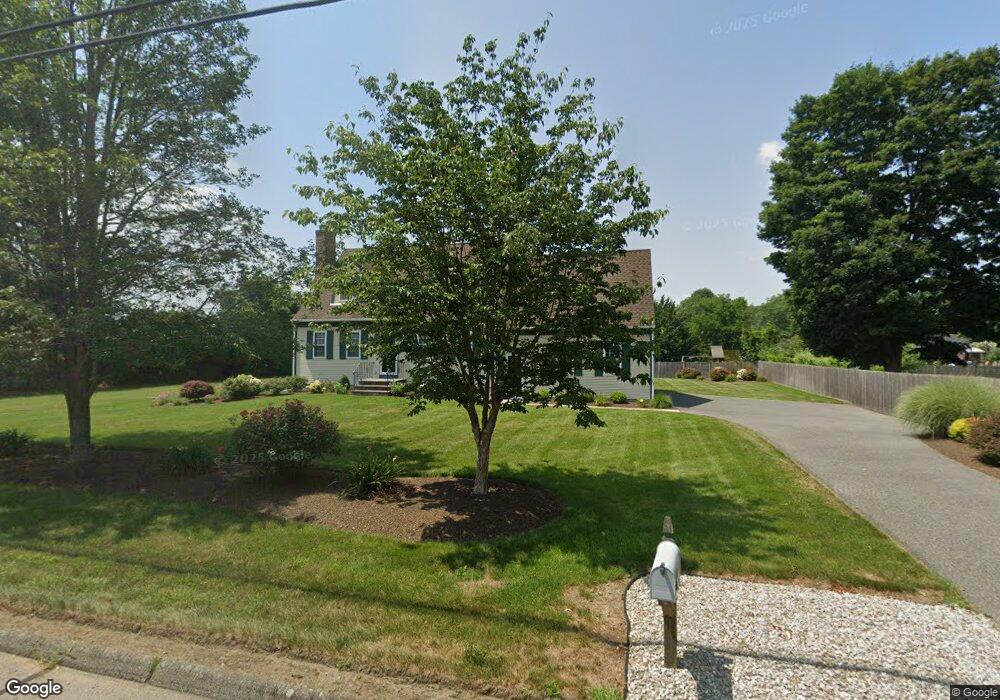
117 Olney St Seekonk, MA 02771
Estimated Value: $548,000 - $742,000
3
Beds
2
Baths
1,547
Sq Ft
$400/Sq Ft
Est. Value
About This Home
This home is located at 117 Olney St, Seekonk, MA 02771 and is currently estimated at $618,610, approximately $399 per square foot. 117 Olney St is a home located in Bristol County with nearby schools including Seekonk High School, Ocean State Montessori School, and Providence Country Day School.
Ownership History
Date
Name
Owned For
Owner Type
Purchase Details
Closed on
Jun 15, 2023
Sold by
Powers Glen M
Bought by
Powers Patrick F
Current Estimated Value
Purchase Details
Closed on
Oct 12, 1993
Sold by
Steve Najas Constr Inc
Bought by
Powers Glen M and Powers Maureen A
Home Financials for this Owner
Home Financials are based on the most recent Mortgage that was taken out on this home.
Original Mortgage
$65,000
Interest Rate
6.9%
Mortgage Type
Purchase Money Mortgage
Create a Home Valuation Report for This Property
The Home Valuation Report is an in-depth analysis detailing your home's value as well as a comparison with similar homes in the area
Home Values in the Area
Average Home Value in this Area
Purchase History
| Date | Buyer | Sale Price | Title Company |
|---|---|---|---|
| Powers Patrick F | -- | None Available | |
| Powers Glen M | -- | None Available | |
| Powers Glen M | $161,630 | -- | |
| Steve Najas Constr Inc | $50,000 | -- |
Source: Public Records
Mortgage History
| Date | Status | Borrower | Loan Amount |
|---|---|---|---|
| Previous Owner | Steve Najas Constr Inc | $10,000 | |
| Previous Owner | Steve Najas Constr Inc | $65,000 |
Source: Public Records
Tax History
| Year | Tax Paid | Tax Assessment Tax Assessment Total Assessment is a certain percentage of the fair market value that is determined by local assessors to be the total taxable value of land and additions on the property. | Land | Improvement |
|---|---|---|---|---|
| 2025 | $5,758 | $466,200 | $175,000 | $291,200 |
| 2024 | $5,518 | $446,800 | $175,000 | $271,800 |
| 2023 | $5,310 | $405,000 | $157,200 | $247,800 |
| 2022 | $4,828 | $361,900 | $150,700 | $211,200 |
| 2021 | $4,619 | $340,400 | $133,700 | $206,700 |
| 2020 | $4,326 | $328,500 | $133,700 | $194,800 |
| 2019 | $4,196 | $321,300 | $133,700 | $187,600 |
| 2018 | $4,155 | $311,200 | $133,700 | $177,500 |
| 2017 | $4,037 | $299,900 | $128,000 | $171,900 |
| 2016 | $3,993 | $297,800 | $128,000 | $169,800 |
| 2015 | $3,741 | $282,800 | $119,200 | $163,600 |
Source: Public Records
Map
Nearby Homes
- 9 Tammy Jean Dr
- 132 Jean Dr
- 57 Mohawk Dr
- 54 Sagamore Rd
- 155 Sagamore Rd
- 454 Fall River Ave
- 267 Chestnut St
- 794 County St
- 478 Fall River Ave
- 19 Cypress Rd
- 702 Arcade Ave
- 5 Luther Ave
- 210 Pleasant St
- 44 Hope St
- 32 Morris St
- 14 Evelyn Way
- 277 Providence St
- 42 Taunton Ave
- 72 N Wheaton Ave
- 70 Wheaton Ave
Your Personal Tour Guide
Ask me questions while you tour the home.