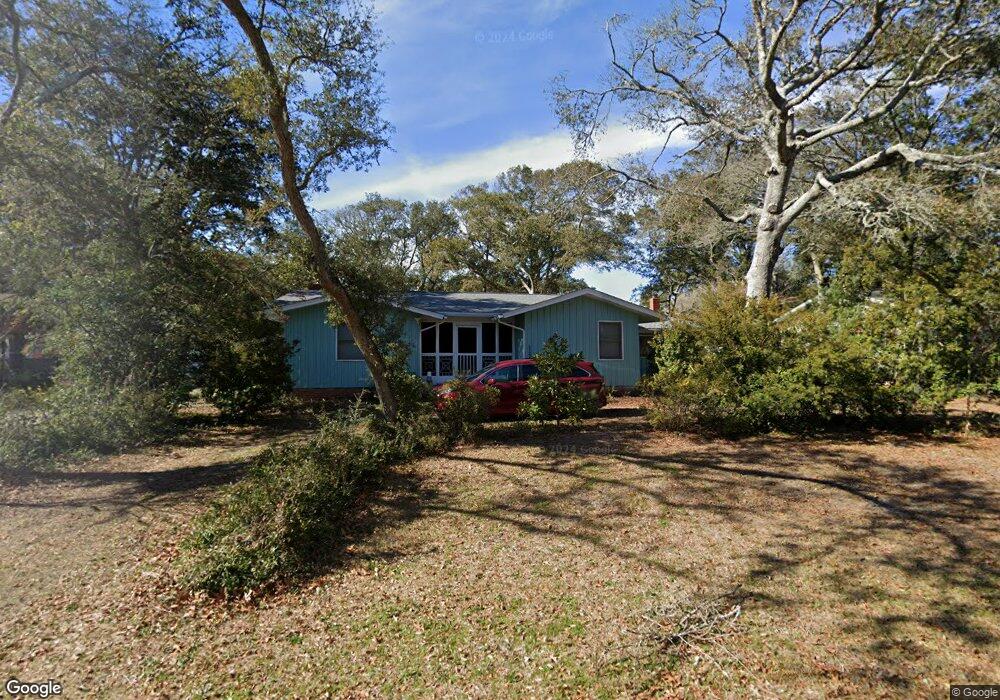
117 SE 3rd St Oak Island, NC 28465
Estimated Value: $443,000 - $544,000
3
Beds
2
Baths
1,701
Sq Ft
$294/Sq Ft
Est. Value
About This Home
This home is located at 117 SE 3rd St, Oak Island, NC 28465 and is currently estimated at $499,928, approximately $293 per square foot. 117 SE 3rd St is a home located in Brunswick County with nearby schools including Southport Elementary School, South Brunswick Middle School, and South Brunswick High School.
Ownership History
Date
Name
Owned For
Owner Type
Purchase Details
Closed on
Dec 7, 2018
Sold by
Apter Douglas and Apter Douglas S
Bought by
Apter Donna Pellock and Pellock Donna E
Current Estimated Value
Purchase Details
Closed on
Nov 19, 2009
Sold by
Us Bank National Association
Bought by
Apter Douglas and Apter Donna Pellock
Purchase Details
Closed on
Jul 28, 2009
Sold by
Stidham Carl V and Stidham Sarah Y
Bought by
Us Bank National Association
Create a Home Valuation Report for This Property
The Home Valuation Report is an in-depth analysis detailing your home's value as well as a comparison with similar homes in the area
Home Values in the Area
Average Home Value in this Area
Purchase History
| Date | Buyer | Sale Price | Title Company |
|---|---|---|---|
| Apter Donna Pellock | -- | None Available | |
| Apter Douglas | $160,000 | None Available | |
| Us Bank National Association | $187,000 | None Available |
Source: Public Records
Tax History
| Year | Tax Paid | Tax Assessment Tax Assessment Total Assessment is a certain percentage of the fair market value that is determined by local assessors to be the total taxable value of land and additions on the property. | Land | Improvement |
|---|---|---|---|---|
| 2025 | $1,870 | $437,180 | $181,250 | $255,930 |
| 2024 | $19 | $437,180 | $181,250 | $255,930 |
| 2023 | $1,484 | $437,180 | $181,250 | $255,930 |
| 2022 | $1,484 | $248,450 | $105,570 | $142,880 |
| 2021 | $1,454 | $248,450 | $105,570 | $142,880 |
| 2020 | $1,429 | $248,450 | $105,570 | $142,880 |
| 2019 | $1,429 | $106,420 | $105,570 | $850 |
| 2018 | $1,148 | $57,570 | $56,610 | $960 |
| 2017 | $1,148 | $57,570 | $56,610 | $960 |
| 2016 | $1,123 | $57,570 | $56,610 | $960 |
| 2015 | $1,123 | $194,920 | $56,610 | $138,310 |
| 2014 | $888 | $163,289 | $68,850 | $94,439 |
Source: Public Records
Map
Nearby Homes
- 120 SE 2nd St
- 6 White Ln
- 304 E Oak Island Dr
- 105 NE 3rd St
- 118 SW 2nd St
- 312 E Dolphin Dr
- 103 NE 5th St
- 316 E Dolphin Dr
- 318 E Beach Dr
- 126 N Middleton Ave
- 120 SW 3rd St
- 122 SW 3rd St
- 129 NE 1st St
- 129 N Middleton Ave
- 112 NW 3rd St
- 137 NE 3rd St
- 137 NE 4th St
- 802 E Oak Island Dr
- 134 NE 5th St
- 210 W Beach Dr
Your Personal Tour Guide
Ask me questions while you tour the home.