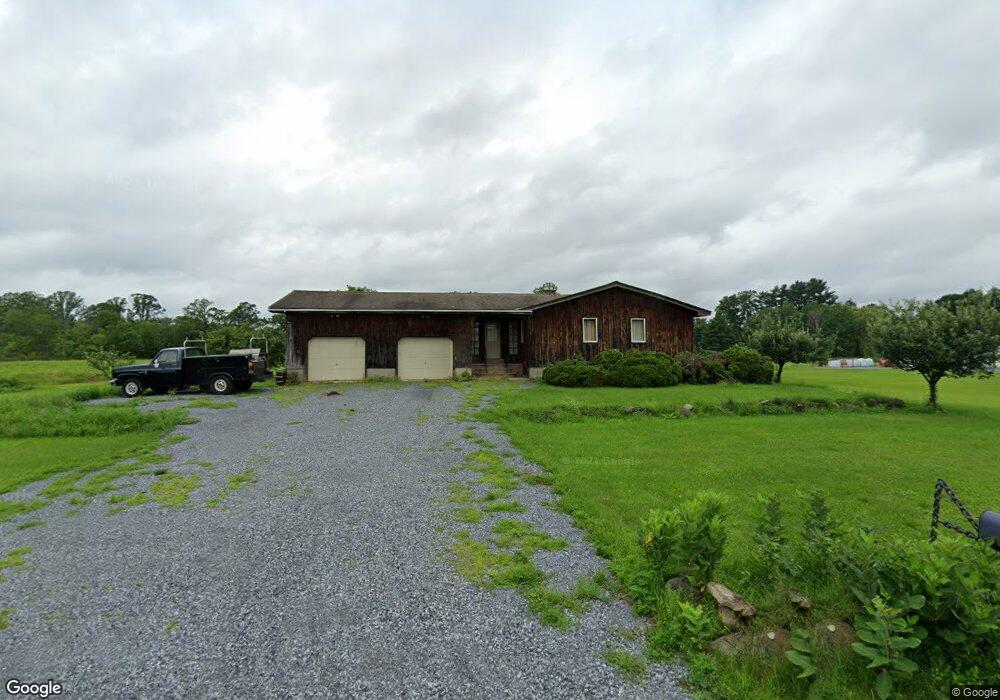
117 Wait Rd Hudson Falls, NY 12839
Estimated Value: $210,000 - $309,000
3
Beds
2
Baths
1,396
Sq Ft
$198/Sq Ft
Est. Value
About This Home
This home is located at 117 Wait Rd, Hudson Falls, NY 12839 and is currently estimated at $276,992, approximately $198 per square foot. 117 Wait Rd is a home located in Washington County with nearby schools including Margaret Murphy Kindergarten Center, Hudson Falls Primary School, and Hudson Falls Intermediate School.
Ownership History
Date
Name
Owned For
Owner Type
Purchase Details
Closed on
Dec 21, 2020
Sold by
Bonanno Stacia and Hewitt Elizabeth
Bought by
Lamoy Frank L
Current Estimated Value
Home Financials for this Owner
Home Financials are based on the most recent Mortgage that was taken out on this home.
Original Mortgage
$140,000
Outstanding Balance
$124,642
Interest Rate
2.7%
Mortgage Type
FHA
Estimated Equity
$152,350
Purchase Details
Closed on
Sep 21, 2010
Sold by
Lamoy Eugene
Bought by
Bononna Stacia
Create a Home Valuation Report for This Property
The Home Valuation Report is an in-depth analysis detailing your home's value as well as a comparison with similar homes in the area
Home Values in the Area
Average Home Value in this Area
Purchase History
| Date | Buyer | Sale Price | Title Company |
|---|---|---|---|
| Lamoy Frank L | $112,500 | None Available | |
| Bononna Stacia | -- | David Little |
Source: Public Records
Mortgage History
| Date | Status | Borrower | Loan Amount |
|---|---|---|---|
| Open | Lamoy Frank L | $140,000 |
Source: Public Records
Tax History
| Year | Tax Paid | Tax Assessment Tax Assessment Total Assessment is a certain percentage of the fair market value that is determined by local assessors to be the total taxable value of land and additions on the property. | Land | Improvement |
|---|---|---|---|---|
| 2024 | $3,942 | $227,200 | $38,900 | $188,300 |
| 2023 | $4,217 | $223,300 | $38,900 | $184,400 |
| 2022 | $4,257 | $212,300 | $38,900 | $173,400 |
| 2021 | $4,183 | $189,800 | $38,900 | $150,900 |
| 2020 | $4,281 | $187,900 | $38,900 | $149,000 |
| 2019 | $4,079 | $187,900 | $38,900 | $149,000 |
| 2018 | $4,079 | $177,300 | $38,900 | $138,400 |
| 2017 | $4,031 | $174,700 | $38,900 | $135,800 |
| 2016 | $3,021 | $164,700 | $38,900 | $125,800 |
| 2015 | -- | $161,500 | $38,900 | $122,600 |
| 2014 | -- | $159,900 | $38,900 | $121,000 |
Source: Public Records
Map
Nearby Homes
Your Personal Tour Guide
Ask me questions while you tour the home.