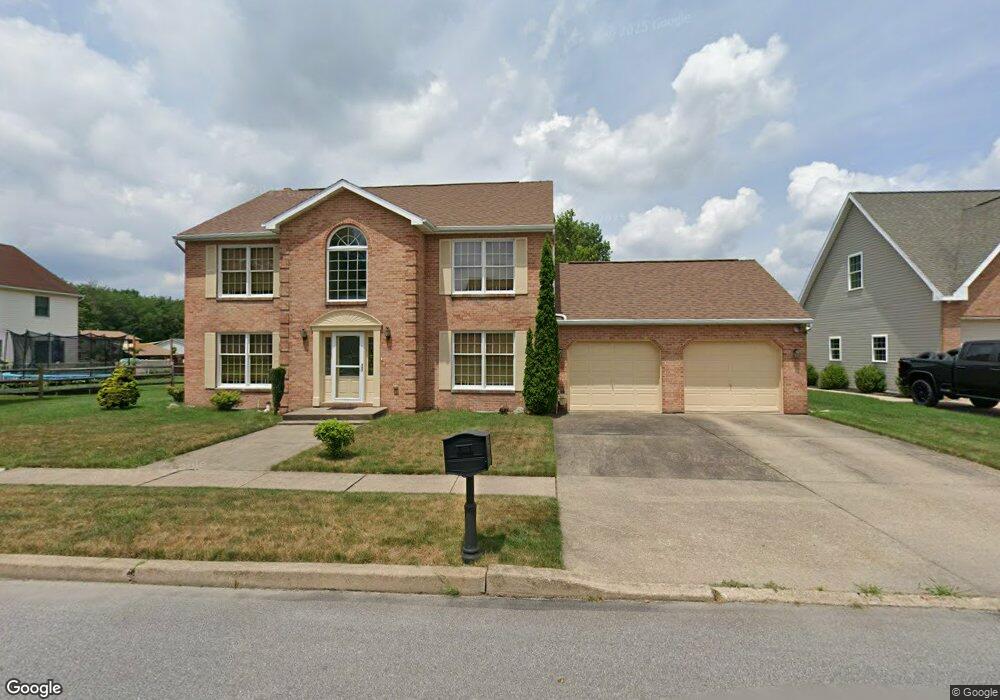
118 Ferrara Ave Hazleton, PA 18201
Estimated Value: $333,730 - $402,000
Studio
--
Bath
2,536
Sq Ft
$147/Sq Ft
Est. Value
About This Home
This home is located at 118 Ferrara Ave, Hazleton, PA 18201 and is currently estimated at $372,433, approximately $146 per square foot. 118 Ferrara Ave is a home located in Luzerne County with nearby schools including Hazleton Area High School, Holy Family Academy, and Immanuel Christian School.
Ownership History
Date
Name
Owned For
Owner Type
Purchase Details
Closed on
Feb 13, 2013
Sold by
Bank Of America Na
Bought by
Secretary Of Housing & Urban Development
Current Estimated Value
Purchase Details
Closed on
Feb 7, 2008
Sold by
Karpenko Larry
Bought by
Gallagher John
Home Financials for this Owner
Home Financials are based on the most recent Mortgage that was taken out on this home.
Original Mortgage
$149,651
Interest Rate
6.14%
Mortgage Type
Purchase Money Mortgage
Purchase Details
Closed on
Dec 22, 1989
Bought by
Ciotola Thomas J
Create a Home Valuation Report for This Property
The Home Valuation Report is an in-depth analysis detailing your home's value as well as a comparison with similar homes in the area
Home Values in the Area
Average Home Value in this Area
Purchase History
We collect this data history from publicly available records. To have your information removed, we recommend requesting removal directly through your county’s website.
| Date | Buyer | Sale Price | Title Company |
|---|---|---|---|
| Secretary Of Housing & Urban Development | -- | None Available | |
| Gallagher John | $152,000 | None Available | |
| Ciotola Thomas J | $177,500 | -- |
Source: Public Records
Mortgage History
We collect this data history from publicly available records. To have your information removed, we recommend requesting removal directly through your county’s website.
| Date | Status | Borrower | Loan Amount |
|---|---|---|---|
| Previous Owner | Gallagher John | $149,651 |
Source: Public Records
Tax History
| Year | Tax Paid | Tax Assessment Tax Assessment Total Assessment is a certain percentage of the fair market value that is determined by local assessors to be the total taxable value of land and additions on the property. | Land | Improvement |
|---|---|---|---|---|
| 2026 | $6,237 | $303,700 | $40,400 | $263,300 |
| 2025 | $8,724 | $303,700 | $40,400 | $263,300 |
| 2024 | $8,173 | $303,700 | $40,400 | $263,300 |
| 2023 | $7,706 | $303,700 | $40,400 | $263,300 |
| 2022 | $3,270 | $303,700 | $40,400 | $263,300 |
| 2021 | $7,409 | $303,700 | $40,400 | $263,300 |
| 2020 | $6,620 | $303,700 | $40,400 | $263,300 |
| 2019 | $6,831 | $303,700 | $40,400 | $263,300 |
| 2018 | $6,598 | $303,700 | $40,400 | $263,300 |
| 2017 | $6,082 | $303,700 | $40,400 | $263,300 |
| 2016 | $3,939 | $303,700 | $40,400 | $263,300 |
| 2015 | $3,911 | $303,700 | $40,400 | $263,300 |
| 2014 | $3,911 | $303,700 | $40,400 | $263,300 |
Source: Public Records
Map
Nearby Homes
- 113 Johns Ave
- 1636 E Broad St
- 155 Coxe St
- 1424 E Broad St
- 160 Coxe St
- 707 Muir Ave
- 1 Circle Dr
- 410 Carleton Ave
- 347 Muir Ave
- 223 Thirwell Ave
- 424 E Cranberry Ave
- 418 E Mine St
- 116 S Poplar St
- 221 S 223 S Pine St
- 83 Birch Knoll Dr
- 101 S Wyoming St
- 10 E Church St
- Lot 46 Mountain Laurel Dr
- 14 Nicole Ln
- 2047 E Broad St
Your Personal Tour Guide
Ask me questions while you tour the home.