Estimated Value: $271,000 - $293,522
About This Home
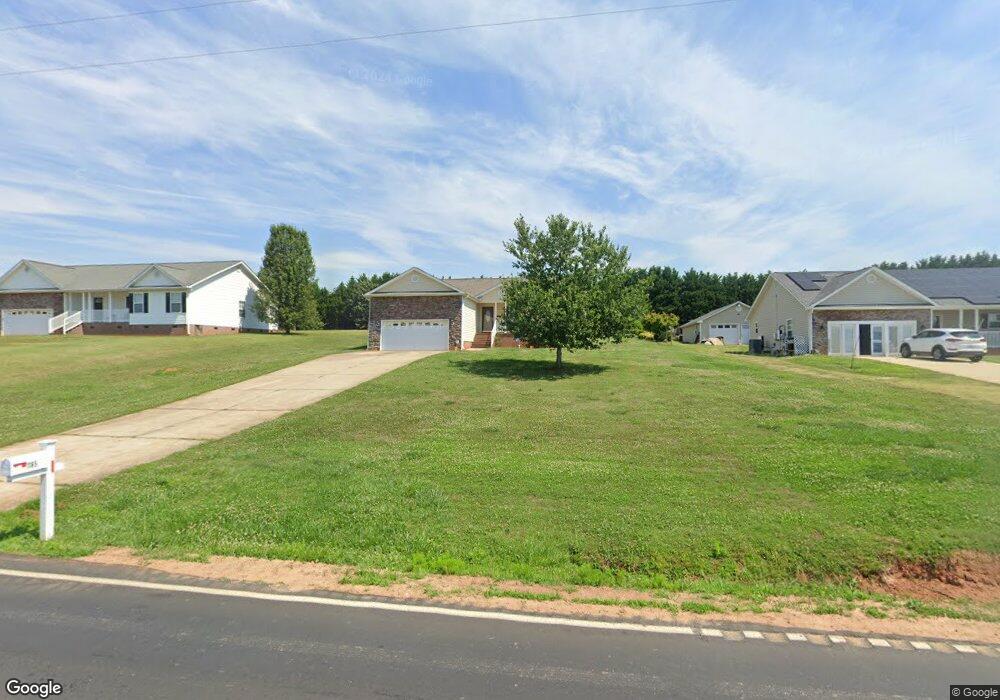
This home is located at 1185 Clark Rd, Inman, SC 29349 and is currently estimated at $279,881, approximately $169 per square foot. 1185 Clark Rd is a home located in Spartanburg County with nearby schools including James H. Hendrix Elementary School, Boiling Springs Middle School, and Boiling Springs High School.
Ownership History
We collect this data history from publicly available records. To have your information removed, we recommend requesting removal directly through your county’s website.
Purchase Details
Home Financials for this Owner
Home Financials are based on the most recent Mortgage that was taken out on this home.Purchase Details
Purchase Details
Home Values in the Area
Average Home Value in this Area
Purchase History
We collect this data history from publicly available records. To have your information removed, we recommend requesting removal directly through your county’s website.
| Date | Buyer | Sale Price | Title Company |
|---|---|---|---|
| $109,900 | -- | ||
| $125,000 | -- | ||
| $19,500 | -- |
Mortgage History
We collect this data history from publicly available records. To have your information removed, we recommend requesting removal directly through your county’s website.
| Date | Status | Borrower | Loan Amount |
|---|---|---|---|
| Open | $100,630 |
Tax History
We collect this data history from publicly available records. To have your information removed, we recommend requesting removal directly through your county’s website.
| Year | Tax Paid | Tax Assessment Tax Assessment Total Assessment is a certain percentage of the fair market value that is determined by local assessors to be the total taxable value of land and additions on the property. | Land | Improvement |
|---|---|---|---|---|
| 2025 | $1,150 | $7,020 | $925 | $6,095 |
| 2023 | $1,150 | $7,020 | $925 | $6,095 |
| 2022 | $1,043 | $6,105 | $748 | $5,357 |
| 2021 | $1,043 | $6,105 | $748 | $5,357 |
| 2020 | $1,024 | $6,105 | $748 | $5,357 |
| 2019 | $1,024 | $6,105 | $748 | $5,357 |
| 2018 | $999 | $6,105 | $748 | $5,357 |
| 2017 | $895 | $5,308 | $800 | $4,508 |
| 2016 | $895 | $5,308 | $800 | $4,508 |
| 2015 | $872 | $5,308 | $800 | $4,508 |
| 2014 | $867 | $5,308 | $800 | $4,508 |
Map
- 1215 Bishop Rd
- 262 Proffitts Way
- 1370 Bishop Rd
- 2063 Blessed Dr
- 2045 Blessed Dr
- 436 N Ivestor Ct
- 2033 Blessed Dr
- 2021 Blessed Dr
- 2032 Blessed Dr
- 2027 Blessed Dr
- 804 Clark Rd
- 1620 Bishop Rd
- 712 Hayden Ln
- 123 Dunnsmore Dr
- 1427 Boatswain Dr
- 528 Bailey Elizabeth Way
- 1268 Dockyard Ln
- 1268 Dockyard Ln Unit CLE 121
- 313 Highland Springs Loop
- 1267 Dockyard Ln Unit CLE 70
Ask me questions while you tour the home.