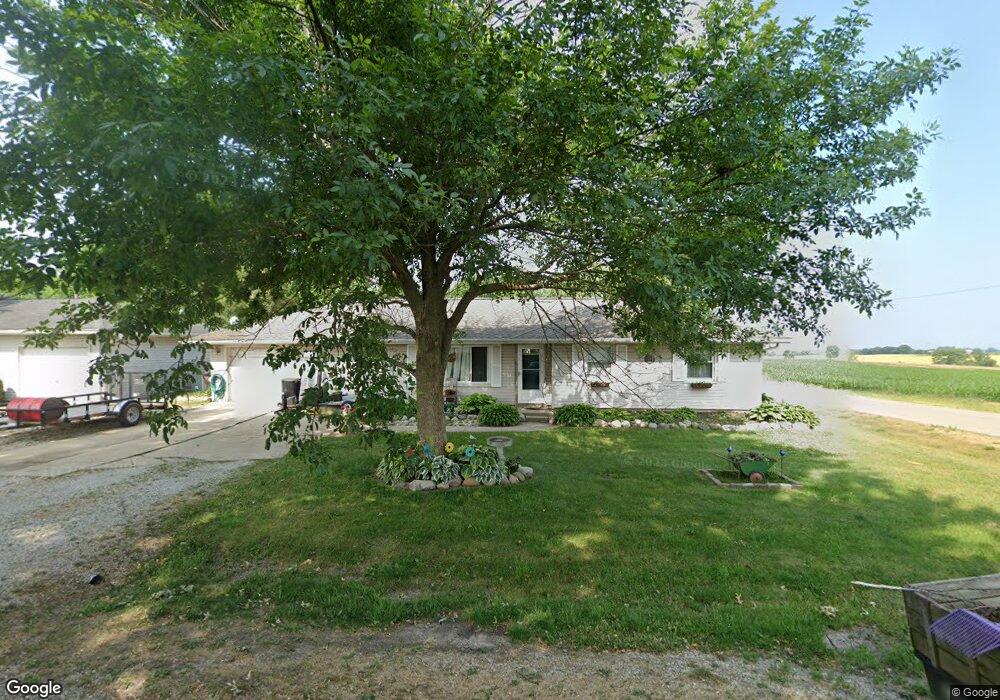
119 Bryant St Morton, IL 61550
Morton AreaEstimated Value: $159,000 - $180,000
About This Home
This home is located at 119 Bryant St, Morton, IL 61550 and is currently estimated at $169,756, approximately $167 per square foot. 119 Bryant St is a home located in Tazewell County with nearby schools including Morton High School, Blessed Sacrament School, and Bethel Lutheran School.
Ownership History
We collect this data history from publicly available records. To have your information removed, we recommend requesting removal directly through your county’s website.
Purchase Details
Home Financials for this Owner
Home Financials are based on the most recent Mortgage that was taken out on this home.Purchase History
We collect this data history from publicly available records. To have your information removed, we recommend requesting removal directly through your county’s website.
| Date | Buyer | Sale Price | Title Company |
|---|---|---|---|
| -- | None Available |
Mortgage History
We collect this data history from publicly available records. To have your information removed, we recommend requesting removal directly through your county’s website.
| Date | Status | Borrower | Loan Amount |
|---|---|---|---|
| Closed | $80,750 | ||
| Closed | $8,000 |
Tax History
We collect this data history from publicly available records. To have your information removed, we recommend requesting removal directly through your county’s website.
| Year | Tax Paid | Tax Assessment Tax Assessment Total Assessment is a certain percentage of the fair market value that is determined by local assessors to be the total taxable value of land and additions on the property. | Land | Improvement |
|---|---|---|---|---|
| 2025 | $2,451 | $52,910 | $7,360 | $45,550 |
| 2024 | $2,336 | $43,450 | $6,870 | $36,580 |
| 2023 | $2,336 | $40,480 | $6,400 | $34,080 |
| 2022 | $2,225 | $37,180 | $5,880 | $31,300 |
| 2021 | $2,122 | $35,750 | $5,650 | $30,100 |
| 2020 | $2,051 | $35,390 | $5,590 | $29,800 |
| 2019 | $2,049 | $35,390 | $5,590 | $29,800 |
| 2018 | $2,012 | $35,390 | $5,590 | $29,800 |
| 2017 | $1,960 | $33,740 | $5,330 | $28,410 |
| 2016 | $1,917 | $33,740 | $5,330 | $28,410 |
| 2015 | $1,832 | $0 | $0 | $0 |
| 2013 | $1,814 | $33,740 | $5,330 | $28,410 |
Map
- 1214 Whippoorwill Dr
- 700 Taylor St
- 624 N Nebraska Ave
- 346 S Nebraska Ave
- 501-503 Pierce St
- 217 N Indiana Ave
- 249 N Illinois Ave
- 540 N Main St
- 313 N 3rd Ave
- 119 E Van Buren St
- 308 S 7th Ave
- 470 E Fernwood St
- 420 Brentwood Rd Unit 105
- 310 E Adams St
- 433 E Fernwood St
- 646 S 4th Ave Unit 18
- 211 W Pershing St
- 138 Knollcrest Ave
- 18067 Dee Mac Rd
- 273 E Hazelwood St
Ask me questions while you tour the home.