
Seller's Agent in 2017
Naveen Kalagara
Kirans & Associates Realty
(480) 652-4455
4 in this area
35 Total Sales
Estimated Value: $674,675 - $764,000
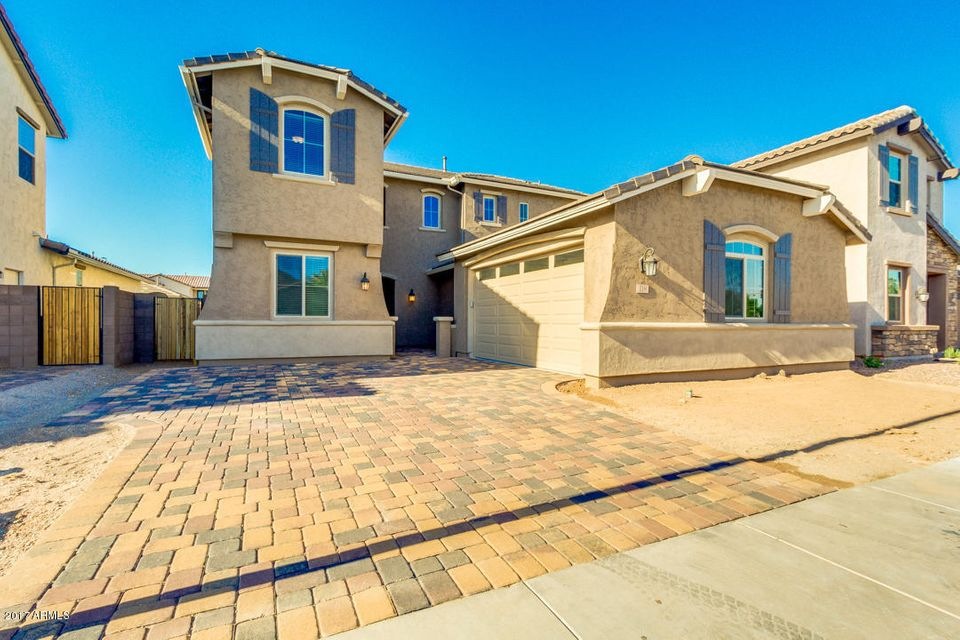
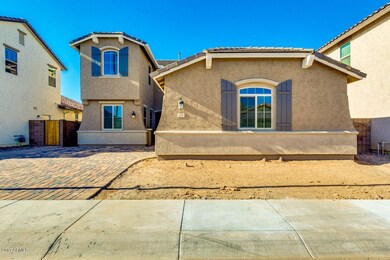
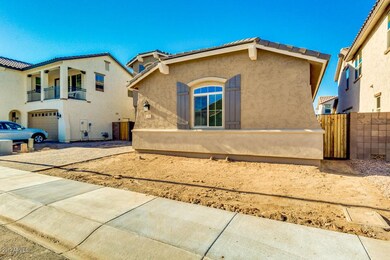
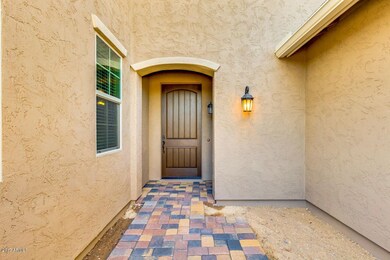
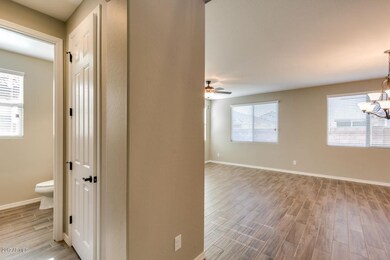
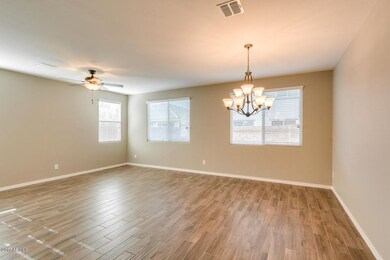
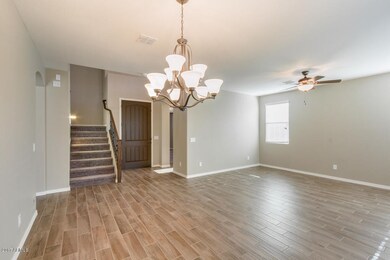
***New Designer Front and Backyard Landscaping was done with Travertine and Artificial Turf*** Brand New Home in Highly Desirable FULTON RANCH PREMIER GATED COMMUNITY - Close to 'CHANDLER BASIS SOUTH' School, Shopping, Restaurants and Entertainment. Upgraded Cabinets, Upgraded Counter-tops, Upgraded Flooring and Upgraded Appliances. Popular Stonehedge Floor Plan, 2,723 sq. ft. 4 Bedroom + Loft, 3 full baths. Living & Dining Room With Large Kitchen and Island, Large Master Bedroom With Upgraded Shower & Bath, Paver Driveways, Energy Star 3 Rated, Ceiling Fans, 16 SEER A/C Units, Community pool, Playgrounds, Basketball, Ramada's With BBQ Grills. Must See To Appreciate! Schedule a showing today! Price reduced to sell quickly.
Last Agent to Sell the Property
Kosh Realty License #SA649654000 Listed on: 05/12/2017
Last Buyer's Agent
Non-MLS Agent
Non-MLS Office
We collect this data history from publicly available records. To have your information removed, we recommend requesting removal directly through your county’s website.
We collect this data history from publicly available records. To have your information removed, we recommend requesting removal directly through your county’s website.
| Date | Buyer | Sale Price | Title Company |
|---|---|---|---|
| -- | Prestige Title & Escrow Agen | ||
| $435,000 | Prestige Title & Escrow Agen | ||
| -- | Security Title Agency Inc | ||
| $387,382 | Security Title Agency Inc | ||
| $121,334 | Security Title Agency Inc |
We collect this data history from publicly available records. To have your information removed, we recommend requesting removal directly through your county’s website.
| Date | Status | Borrower | Loan Amount |
|---|---|---|---|
| Open | $413,250 | ||
| Previous Owner | $305,600 |
We collect this data history from publicly available records. To have your information removed, we recommend requesting removal directly through your county’s website.
| Date | Event | Price | List to Sale | Price per Sq Ft |
|---|---|---|---|---|
| 11/09/2017 11/09/17 | Sold | $435,000 | -3.1% | $160 / Sq Ft |
| 10/20/2017 10/20/17 | For Sale | $449,000 | 0.0% | $165 / Sq Ft |
| 10/20/2017 10/20/17 | Price Changed | $449,000 | 0.0% | $165 / Sq Ft |
| 10/17/2017 10/17/17 | Pending | -- | -- | -- |
| 10/13/2017 10/13/17 | Price Changed | $449,000 | +0.9% | $165 / Sq Ft |
| 10/03/2017 10/03/17 | Price Changed | $445,000 | -1.1% | $163 / Sq Ft |
| 09/20/2017 09/20/17 | Price Changed | $450,000 | -0.2% | $165 / Sq Ft |
| 09/14/2017 09/14/17 | Price Changed | $451,000 | -0.2% | $166 / Sq Ft |
| 09/08/2017 09/08/17 | Price Changed | $452,000 | -0.1% | $166 / Sq Ft |
| 09/01/2017 09/01/17 | Price Changed | $452,500 | -0.1% | $166 / Sq Ft |
| 08/24/2017 08/24/17 | Price Changed | $453,000 | -0.2% | $166 / Sq Ft |
| 08/16/2017 08/16/17 | Price Changed | $454,000 | -0.4% | $167 / Sq Ft |
| 08/10/2017 08/10/17 | Price Changed | $456,000 | -0.4% | $167 / Sq Ft |
| 07/28/2017 07/28/17 | Price Changed | $458,000 | -0.4% | $168 / Sq Ft |
| 07/21/2017 07/21/17 | Price Changed | $460,000 | -0.1% | $169 / Sq Ft |
| 07/13/2017 07/13/17 | Price Changed | $460,500 | +0.1% | $169 / Sq Ft |
| 07/07/2017 07/07/17 | Price Changed | $460,000 | -0.3% | $169 / Sq Ft |
| 06/30/2017 06/30/17 | Price Changed | $461,400 | 0.0% | $169 / Sq Ft |
| 06/23/2017 06/23/17 | Price Changed | $461,500 | -0.1% | $169 / Sq Ft |
| 06/15/2017 06/15/17 | Price Changed | $462,000 | -0.1% | $170 / Sq Ft |
| 06/07/2017 06/07/17 | Price Changed | $462,500 | -0.1% | $170 / Sq Ft |
| 06/01/2017 06/01/17 | Price Changed | $463,000 | -0.2% | $170 / Sq Ft |
| 05/25/2017 05/25/17 | Price Changed | $464,000 | -0.2% | $170 / Sq Ft |
| 05/12/2017 05/12/17 | For Sale | $465,000 | -- | $171 / Sq Ft |
We collect this data history from publicly available records. To have your information removed, we recommend requesting removal directly through your county’s website.
| Year | Tax Paid | Tax Assessment Tax Assessment Total Assessment is a certain percentage of the fair market value that is determined by local assessors to be the total taxable value of land and additions on the property. | Land | Improvement |
|---|---|---|---|---|
| 2025 | $3,166 | $33,856 | -- | -- |
| 2024 | $3,055 | $32,244 | -- | -- |
| 2023 | $3,055 | $51,150 | $10,230 | $40,920 |
| 2022 | $2,959 | $40,810 | $8,160 | $32,650 |
| 2021 | $3,041 | $39,600 | $7,920 | $31,680 |
| 2020 | $3,024 | $38,130 | $7,620 | $30,510 |
| 2019 | $2,918 | $35,570 | $7,110 | $28,460 |
| 2018 | $2,835 | $8,730 | $8,730 | $0 |
| 2017 | $437 | $8,085 | $8,085 | $0 |
| 2016 | $422 | $7,515 | $7,515 | $0 |
| 2015 | $432 | $6,176 | $6,176 | $0 |
Seller's Agent in 2017
Naveen Kalagara
Kirans & Associates Realty
(480) 652-4455
4 in this area
35 Total Sales
N
Buyer's Agent in 2017
Non-MLS Agent
Non-MLS Office
Source: Arizona Regional Multiple Listing Service (ARMLS)
MLS Number: 5604767
APN: 303-54-728
Disclaimer: Certain information contained herein is derived from information provided by parties other than Homes.com. All information provided is deemed reliable, but is not guaranteed to be accurate and should be independently verified.
![]() All information should be verified by the recipient and none is guaranteed as accurate by ARMLS
All information should be verified by the recipient and none is guaranteed as accurate by ARMLS
Listing Information presented by local MLS brokerage: Ten-X, local REALTOR®- Arlene Richardson - (888)-952-6393
Ask me questions while you tour the home.