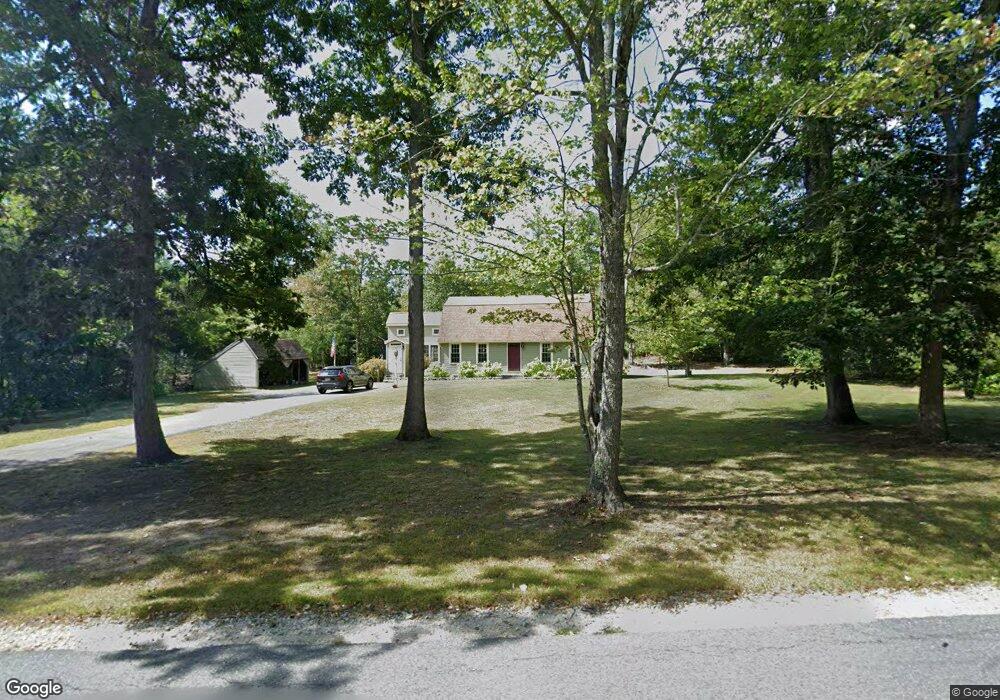
119 Hall St Dunstable, MA 01827
Estimated Value: $639,000 - $673,000
3
Beds
2
Baths
2,246
Sq Ft
$292/Sq Ft
Est. Value
About This Home
This home is located at 119 Hall St, Dunstable, MA 01827 and is currently estimated at $655,229, approximately $291 per square foot. 119 Hall St is a home located in Middlesex County with nearby schools including Groton Dunstable Regional High School.
Ownership History
Date
Name
Owned For
Owner Type
Purchase Details
Closed on
Aug 24, 2020
Sold by
Burt Kenneth N
Bought by
Quirbach Brian and Quirbach Morgan D
Current Estimated Value
Home Financials for this Owner
Home Financials are based on the most recent Mortgage that was taken out on this home.
Original Mortgage
$427,405
Outstanding Balance
$379,138
Interest Rate
3%
Mortgage Type
New Conventional
Estimated Equity
$276,091
Purchase Details
Closed on
Feb 6, 1963
Bought by
Burt Kenneth and Burt Nancy
Create a Home Valuation Report for This Property
The Home Valuation Report is an in-depth analysis detailing your home's value as well as a comparison with similar homes in the area
Home Values in the Area
Average Home Value in this Area
Purchase History
| Date | Buyer | Sale Price | Title Company |
|---|---|---|---|
| Quirbach Brian | $449,900 | None Available | |
| Burt Kenneth | -- | -- |
Source: Public Records
Mortgage History
| Date | Status | Borrower | Loan Amount |
|---|---|---|---|
| Open | Quirbach Brian | $427,405 |
Source: Public Records
Tax History
| Year | Tax Paid | Tax Assessment Tax Assessment Total Assessment is a certain percentage of the fair market value that is determined by local assessors to be the total taxable value of land and additions on the property. | Land | Improvement |
|---|---|---|---|---|
| 2025 | $7,486 | $544,400 | $212,000 | $332,400 |
| 2024 | $7,135 | $511,100 | $195,700 | $315,400 |
| 2023 | $7,121 | $475,700 | $195,700 | $280,000 |
| 2022 | $6,643 | $435,600 | $195,700 | $239,900 |
| 2021 | $6,198 | $377,700 | $179,400 | $198,300 |
| 2020 | $6,216 | $369,100 | $179,400 | $189,700 |
| 2019 | $6,094 | $357,200 | $179,400 | $177,800 |
| 2018 | $6,021 | $343,300 | $179,400 | $163,900 |
| 2017 | $5,770 | $339,000 | $179,400 | $159,600 |
| 2016 | $5,450 | $329,300 | $171,200 | $158,100 |
| 2015 | $5,059 | $302,400 | $143,500 | $158,900 |
| 2014 | $4,769 | $302,400 | $143,500 | $158,900 |
Source: Public Records
Map
Nearby Homes
- 2 Wildflower Ln
- 0 Old Dunstable Rd
- 179 Wyman Rd
- 208 North St
- 0 Lowell St
- 11 Unkety Brook Way
- 12 Unkety Brook Way
- 8 Unkety Brook Way
- 4 Unkety Brook Way
- 91 Chicopee Row
- 58 Lowell Rd
- 53 Mclains Woods Rd
- 200 Nashua Rd
- 473 High St
- 57 French Ct
- 114 Groton St
- 27 Merrimac Dr
- 29 Tarbell St
- 17 Merrimac Dr
- 19 Sandstone Rd
Your Personal Tour Guide
Ask me questions while you tour the home.