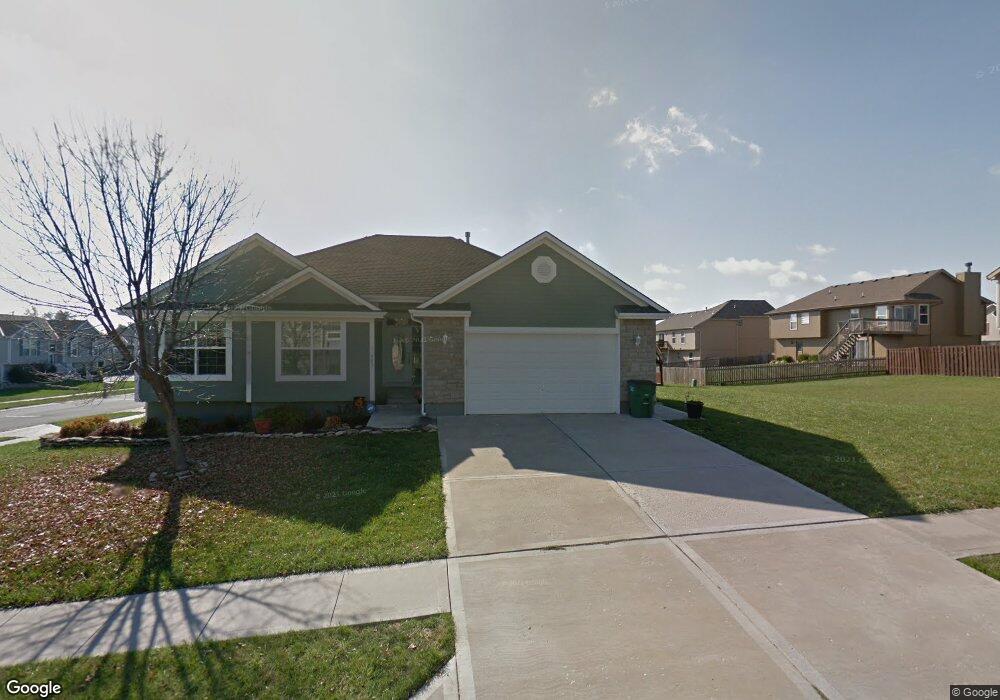
11903 E 214th St Peculiar, MO 64078
Estimated Value: $336,000 - $364,000
3
Beds
2
Baths
1,647
Sq Ft
$210/Sq Ft
Est. Value
About This Home
This home is located at 11903 E 214th St, Peculiar, MO 64078 and is currently estimated at $345,174, approximately $209 per square foot. 11903 E 214th St is a home located in Cass County with nearby schools including Bridle Ridge Intermediate School, Raymore-Peculiar South Middle School, and Raymore-Peculiar Senior High School.
Ownership History
Date
Name
Owned For
Owner Type
Purchase Details
Closed on
Sep 16, 2008
Sold by
Us Bank Na
Bought by
Scrogham Daniel Lee and Scrogham Amanda Jill
Current Estimated Value
Home Financials for this Owner
Home Financials are based on the most recent Mortgage that was taken out on this home.
Original Mortgage
$133,000
Outstanding Balance
$87,738
Interest Rate
6.52%
Mortgage Type
Purchase Money Mortgage
Estimated Equity
$257,436
Purchase Details
Closed on
May 16, 2008
Sold by
Pittman Gary L and Pittman Wanda Kay
Bought by
Us Bank Na
Create a Home Valuation Report for This Property
The Home Valuation Report is an in-depth analysis detailing your home's value as well as a comparison with similar homes in the area
Home Values in the Area
Average Home Value in this Area
Purchase History
| Date | Buyer | Sale Price | Title Company |
|---|---|---|---|
| Scrogham Daniel Lee | -- | -- | |
| Us Bank Na | $120,000 | -- |
Source: Public Records
Mortgage History
| Date | Status | Borrower | Loan Amount |
|---|---|---|---|
| Open | Scrogham Daniel Lee | $133,000 |
Source: Public Records
Tax History
| Year | Tax Paid | Tax Assessment Tax Assessment Total Assessment is a certain percentage of the fair market value that is determined by local assessors to be the total taxable value of land and additions on the property. | Land | Improvement |
|---|---|---|---|---|
| 2025 | $2,993 | $42,440 | $6,660 | $35,780 |
| 2024 | $2,993 | $37,910 | $6,050 | $31,860 |
| 2023 | $2,974 | $37,910 | $6,050 | $31,860 |
| 2022 | $2,697 | $33,270 | $6,050 | $27,220 |
| 2021 | $2,789 | $33,270 | $6,050 | $27,220 |
| 2020 | $2,740 | $32,660 | $6,050 | $26,610 |
| 2019 | $2,736 | $32,660 | $6,050 | $26,610 |
| 2018 | $2,593 | $29,200 | $5,190 | $24,010 |
| 2017 | $2,473 | $29,200 | $5,190 | $24,010 |
| 2016 | $2,473 | $27,760 | $5,190 | $22,570 |
| 2015 | $2,403 | $27,760 | $5,190 | $22,570 |
| 2014 | $2,184 | $27,760 | $5,190 | $22,570 |
| 2013 | -- | $27,760 | $5,190 | $22,570 |
Source: Public Records
Map
Nearby Homes
- 21406 Red Oak Ln
- 995 Hurley St
- 972 Glengera St
- 12204 E 214th St
- 12204 White Oak St
- 985 Harr-Grove Rd
- 12301 S Burr Oak Cir
- 881 E 1st St
- 1400 Larkspur Dr
- 1308 Larkspur Dr
- Lot #17 Twin Oaks Pkwy
- Lot #2 Twin Oaks Pkwy
- Lot #1 Twin Oaks Pkwy
- Lot #18 Twin Oaks Pkwy
- 729 Hurley St
- 20918 Larkspur Dr
- 0 N Main St Unit HMS2442107
- Tract 1 School Rd
- Lot 1 Main St
- 0 N Rd Unit HMS2442105
- 11811 E 214th St
- 21405 Pin Oak Ln
- 11909 E 214th St
- 11902 E 214th St
- 11900 E 214th St
- 12206 E 214th St
- 11906 E 214th St
- 21409 Pin Oak Ln
- 21407 Red Oak Ln
- 21323 Pin Oak Ln
- 11911 E 214th St
- 11910 E 214th St
- 11902 White Oak St
- 11910 E 214th Terrace
- 11903 E 213th Terrace
- 11901 E 213th Terrace
- 21400 Pin Oak Ln
- 21404 Pin Oak Ln
- 11907 E 213th Terrace
- 21324 Pin Oak Ln
Your Personal Tour Guide
Ask me questions while you tour the home.