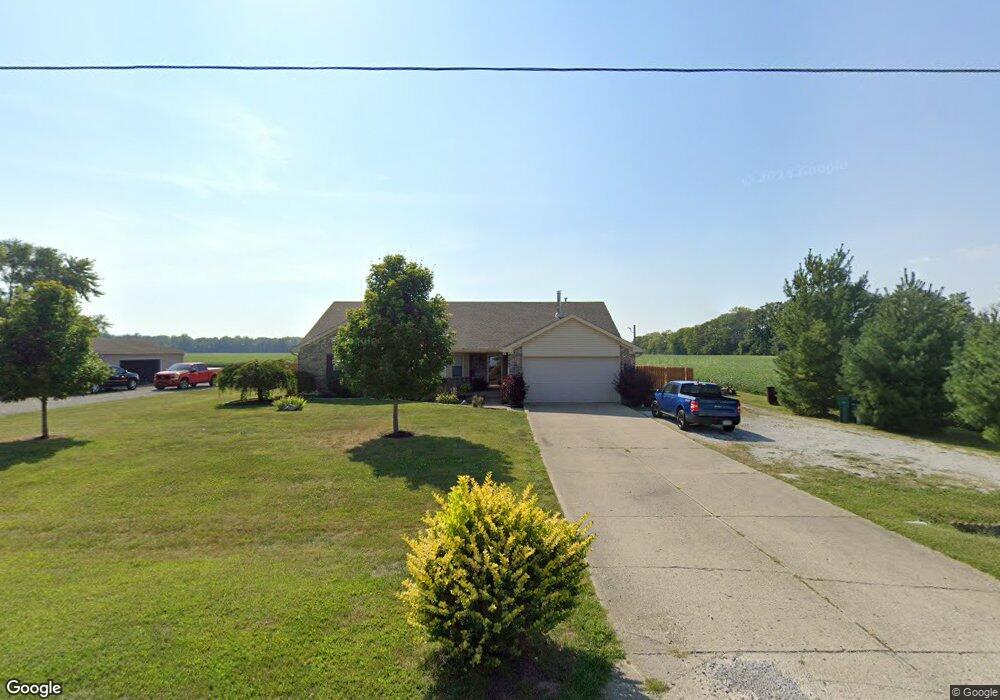
1194 S 400 E Greenfield, IN 46140
Greenfield AreaEstimated Value: $316,000 - $392,753
About This Home
This home is located at 1194 S 400 E, Greenfield, IN 46140 and is currently estimated at $352,938, approximately $170 per square foot. 1194 S 400 E is a home located in Hancock County with nearby schools including Greenfield Intermediate School, Harris Elementary School, and Greenfield Central Junior High School.
Ownership History
We collect this data history from publicly available records. To have your information removed, we recommend requesting removal directly through your county’s website.
Purchase Details
Home Financials for this Owner
Home Financials are based on the most recent Mortgage that was taken out on this home.Home Values in the Area
Average Home Value in this Area
Purchase History
We collect this data history from publicly available records. To have your information removed, we recommend requesting removal directly through your county’s website.
| Date | Buyer | Sale Price | Title Company |
|---|---|---|---|
| -- | -- |
Mortgage History
We collect this data history from publicly available records. To have your information removed, we recommend requesting removal directly through your county’s website.
| Date | Status | Borrower | Loan Amount |
|---|---|---|---|
| Open | $133,572 | ||
| Closed | $17,000 | ||
| Closed | $174,250 | ||
| Closed | $162,011 |
Tax History
We collect this data history from publicly available records. To have your information removed, we recommend requesting removal directly through your county’s website.
| Year | Tax Paid | Tax Assessment Tax Assessment Total Assessment is a certain percentage of the fair market value that is determined by local assessors to be the total taxable value of land and additions on the property. | Land | Improvement |
|---|---|---|---|---|
| 2025 | $2,266 | $352,900 | $57,900 | $295,000 |
| 2024 | $2,661 | $362,600 | $57,900 | $304,700 |
| 2023 | $2,661 | $334,300 | $57,900 | $276,400 |
| 2022 | $1,859 | $248,200 | $33,100 | $215,100 |
| 2021 | $1,595 | $216,600 | $31,300 | $185,300 |
| 2020 | $1,602 | $207,500 | $31,300 | $176,200 |
| 2019 | $1,576 | $205,500 | $31,300 | $174,200 |
| 2018 | $1,637 | $208,900 | $31,300 | $177,600 |
| 2017 | $1,708 | $204,800 | $31,300 | $173,500 |
| 2016 | $1,876 | $203,900 | $31,300 | $172,600 |
| 2014 | $1,766 | $202,800 | $31,300 | $171,500 |
| 2013 | $1,766 | $184,500 | $31,300 | $153,200 |
Map
- 425 Thunderwood Dr
- 437 Thunderwood Dr
- 468 Tracewood Bend
- 1967 Brookside Ct
- 524 Haywood Dr
- 503 Bourneside Dr
- 2760 S Morristown Pike
- 526 Bourneside Dr
- 1968 Branchside Ct
- 620 Bobtail Dr
- 1647 Sweetwater Ln
- 1781 Stonewall Cir
- 1083 E South St
- 327 Shadow Creek Pass
- 342 Shadow Creek Pass
- 327 Shadow Creek Pass
- 502 Streamside Dr
- 632 Runnymede Ct
- 1132 Chapman Dr
- 1518 Pippin Dr
Ask me questions while you tour the home.