12 Bryce Rd Holmdel, NJ 07733
Estimated Value: $1,261,000 - $1,837,000
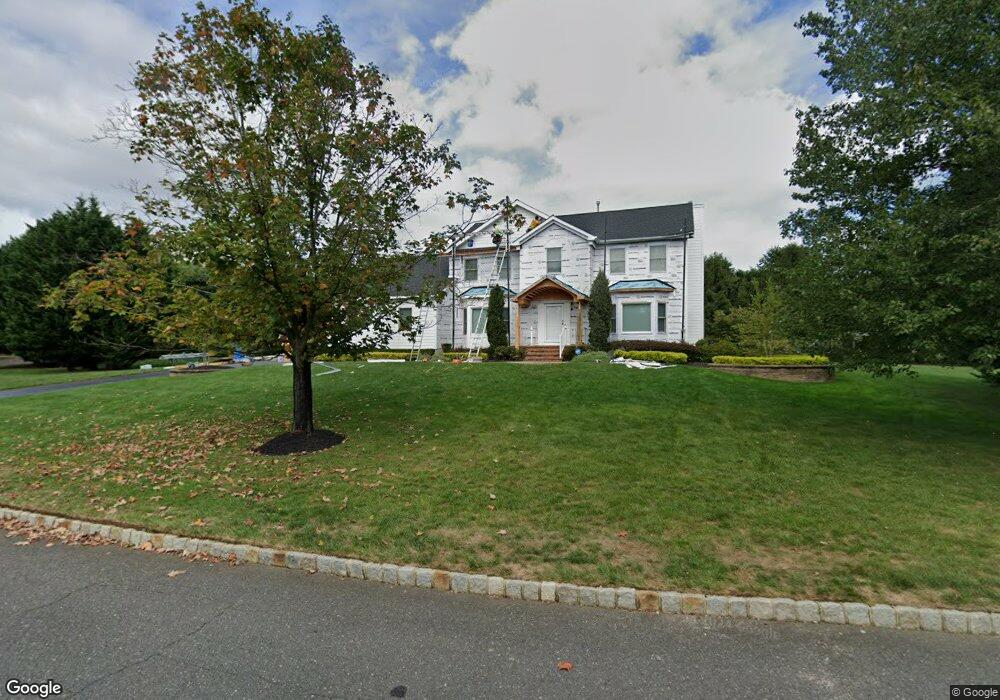
About This Home
This home is located at 12 Bryce Rd, Holmdel, NJ 07733 and is currently estimated at $1,530,191, approximately $449 per square foot. 12 Bryce Rd is a home located in Monmouth County with nearby schools including Village School, Indian Hill Elementary School, and William Satz Intermediate School.
Ownership History
We collect this data history from publicly available records. To have your information removed, we recommend requesting removal directly through your county’s website.
Purchase Details
Home Financials for this Owner
Home Financials are based on the most recent Mortgage that was taken out on this home.Purchase Details
Home Financials for this Owner
Home Financials are based on the most recent Mortgage that was taken out on this home.Home Values in the Area
Average Home Value in this Area
Purchase History
We collect this data history from publicly available records. To have your information removed, we recommend requesting removal directly through your county’s website.
| Date | Buyer | Sale Price | Title Company |
|---|---|---|---|
| $822,000 | -- | ||
| $440,650 | -- |
Mortgage History
We collect this data history from publicly available records. To have your information removed, we recommend requesting removal directly through your county’s website.
| Date | Status | Borrower | Loan Amount |
|---|---|---|---|
| Previous Owner | $522,000 | ||
| Previous Owner | $275,000 |
Tax History
We collect this data history from publicly available records. To have your information removed, we recommend requesting removal directly through your county’s website.
| Year | Tax Paid | Tax Assessment Tax Assessment Total Assessment is a certain percentage of the fair market value that is determined by local assessors to be the total taxable value of land and additions on the property. | Land | Improvement |
|---|---|---|---|---|
| 2025 | $19,141 | $1,301,100 | $611,200 | $689,900 |
| 2024 | $18,318 | $1,214,500 | $580,400 | $634,100 |
| 2023 | $18,318 | $1,125,900 | $528,800 | $597,100 |
| 2022 | $17,372 | $960,200 | $472,000 | $488,200 |
| 2021 | $17,372 | $866,000 | $393,400 | $472,600 |
| 2020 | $17,588 | $862,600 | $403,400 | $459,200 |
| 2019 | $17,299 | $852,600 | $361,500 | $491,100 |
| 2018 | $17,813 | $881,400 | $357,000 | $524,400 |
| 2017 | $18,320 | $902,900 | $362,000 | $540,900 |
| 2016 | $17,749 | $884,800 | $327,000 | $557,800 |
| 2015 | $17,139 | $857,400 | $314,000 | $543,400 |
| 2014 | $16,582 | $793,400 | $404,000 | $389,400 |
Map
- 1 Tuller Ct
- 7 Mccampbell Rd
- 5 Coventry Square
- 31 Mccampbell Rd
- 211 Yale Dr
- 216 Yale Dr
- 4 Blue Hills Dr
- 86 Stillwell Rd
- 6 Chardonnay Dr
- 66 Windermere Rd
- 1 Ashbourne Ln
- 0 Sunnyside Rd
- 68 Mccampbell Rd
- 9 Foulks Terrace Unit 1905
- 32 Seagull Ln
- 18 Waterford Way
- 25 Ely Rd
- 4 Storm Rd
- 110 Augusta Dr
- 520 Marl Rd
Ask me questions while you tour the home.