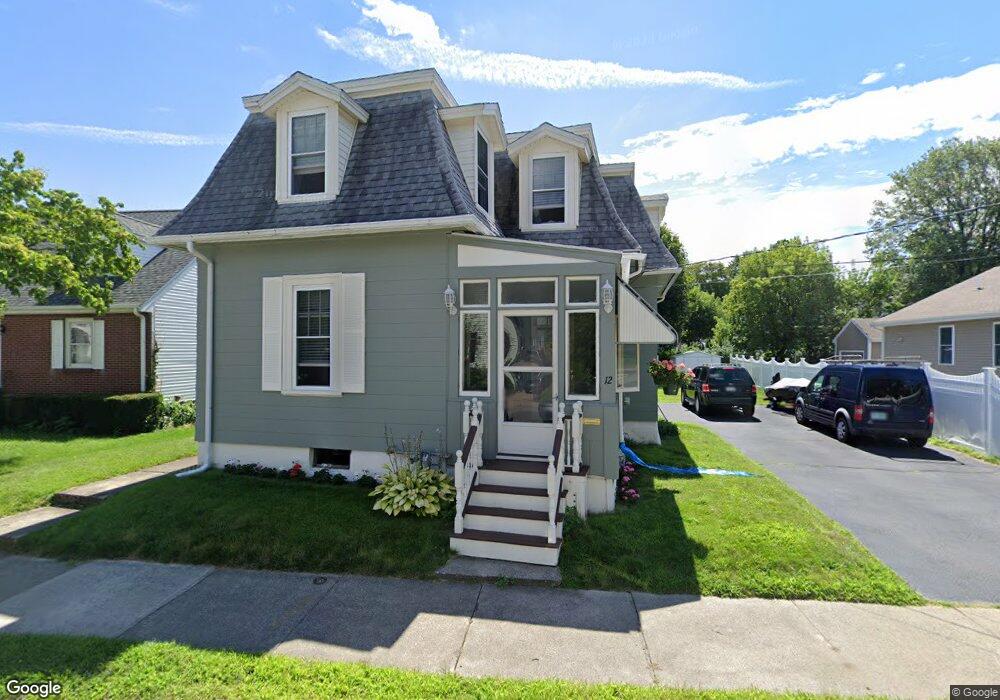
12 Buckman St Woburn, MA 01801
Downtown Woburn NeighborhoodEstimated Value: $674,762 - $741,000
About This Home
This home is located at 12 Buckman St, Woburn, MA 01801 and is currently estimated at $705,441, approximately $472 per square foot. 12 Buckman St is a home located in Middlesex County with nearby schools including Goodyear Elementary School, Daniel L. Joyce Middle School, and Woburn High School.
Ownership History
We collect this data history from publicly available records. To have your information removed, we recommend requesting removal directly through your county’s website.
Purchase Details
Home Financials for this Owner
Home Financials are based on the most recent Mortgage that was taken out on this home.Home Values in the Area
Average Home Value in this Area
Purchase History
We collect this data history from publicly available records. To have your information removed, we recommend requesting removal directly through your county’s website.
| Date | Buyer | Sale Price | Title Company |
|---|---|---|---|
| $120,000 | -- |
Mortgage History
We collect this data history from publicly available records. To have your information removed, we recommend requesting removal directly through your county’s website.
| Date | Status | Borrower | Loan Amount |
|---|---|---|---|
| Closed | $114,000 |
Tax History
We collect this data history from publicly available records. To have your information removed, we recommend requesting removal directly through your county’s website.
| Year | Tax Paid | Tax Assessment Tax Assessment Total Assessment is a certain percentage of the fair market value that is determined by local assessors to be the total taxable value of land and additions on the property. | Land | Improvement |
|---|---|---|---|---|
| 2025 | $4,905 | $574,400 | $290,200 | $284,200 |
| 2024 | $4,356 | $540,400 | $276,400 | $264,000 |
| 2023 | $4,376 | $503,000 | $251,200 | $251,800 |
| 2022 | $4,191 | $448,700 | $218,500 | $230,200 |
| 2021 | $3,836 | $411,200 | $208,000 | $203,200 |
| 2020 | $3,820 | $409,900 | $208,000 | $201,900 |
| 2019 | $3,735 | $393,200 | $198,100 | $195,100 |
| 2018 | $3,551 | $359,000 | $181,800 | $177,200 |
| 2017 | $3,361 | $338,100 | $173,100 | $165,000 |
| 2016 | $3,203 | $318,700 | $161,800 | $156,900 |
| 2015 | $3,078 | $302,700 | $151,200 | $151,500 |
| 2014 | $2,822 | $270,300 | $151,200 | $119,100 |
Map
- 109 Main St Unit 1
- 3 Conn St Unit 3
- 18-20 Buck St Unit 1
- 20 Buck St
- 12 Highland Ave
- 6 Richmond Park
- 14 Cross St
- 380 Cross St
- 49 Sheridan Cir
- 44 Warren Ave Unit B
- 16 Glenwood Ave
- 16 & 16A Glenwood Ave
- 92 Garfield Ave
- 64 Garfield Ave
- 14 Bradford Rd Unit 14
- 23 Shepard Ct Unit U23
- 69r Eastern Ave
- 22 Arthur St
- 52 Pleasant St
- 258 Cross St
- 15 Buckman St
- 13 Buckman St
- 17 Buckman St
- 5 Buckman St
- 12 Ash St
- 20 Ash St
- 10 Ash St
- 3 Buckman St Unit A
- 3 Buckman St
- 14 Buckman St
- 10 Buckman St
- 7 Buckman Ct
- 19 Buckman St
- 19 Buckman St Unit R
- 19 Buckman St Unit F
- 19 Buckman St Unit 19R
- 19 Buckman St Unit A
- 6 Ash St
- 16 Buckman St
- 24 Ash St Unit 24-A
Ask me questions while you tour the home.