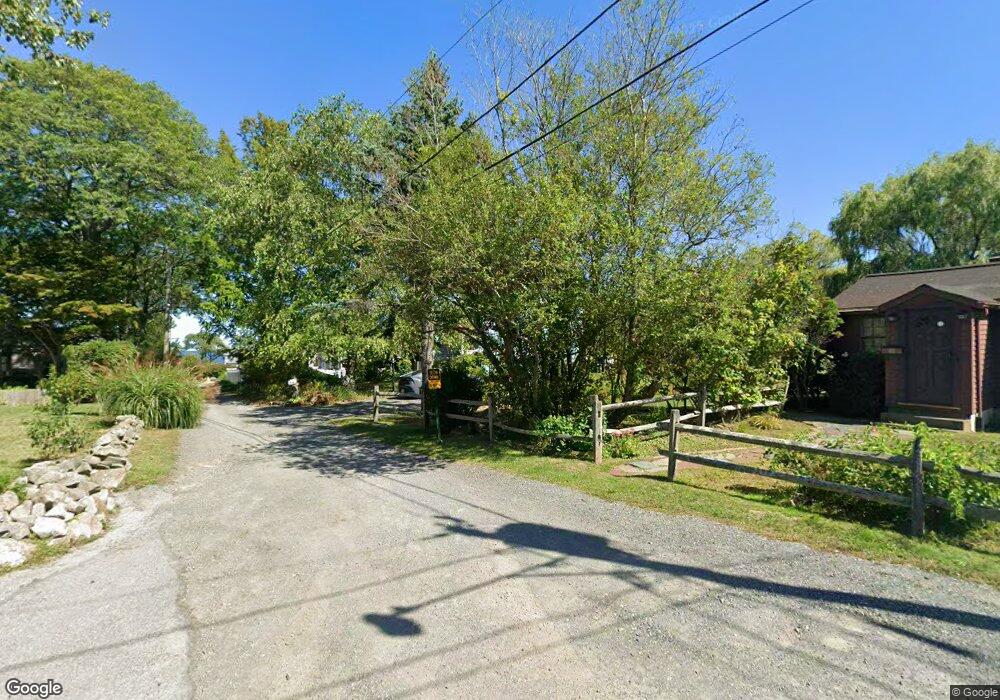
12 Calebs Ln Rockport, MA 01966
Estimated Value: $976,000 - $1,298,000
3
Beds
3
Baths
1,710
Sq Ft
$667/Sq Ft
Est. Value
About This Home
This home is located at 12 Calebs Ln, Rockport, MA 01966 and is currently estimated at $1,139,739, approximately $666 per square foot. 12 Calebs Ln is a home located in Essex County with nearby schools including Rockport Elementary School, Rockport Middle School, and Rockport High School.
Ownership History
Date
Name
Owned For
Owner Type
Purchase Details
Closed on
Jan 25, 2018
Sold by
Gutstadt James R and Goodman Nancy
Bought by
12 Calebs Ln Rockport and 12 Gutstadt
Current Estimated Value
Purchase Details
Closed on
Jul 6, 1994
Sold by
Omalley Joan F
Bought by
Goodman Nancy and Gutstadt James
Create a Home Valuation Report for This Property
The Home Valuation Report is an in-depth analysis detailing your home's value as well as a comparison with similar homes in the area
Home Values in the Area
Average Home Value in this Area
Purchase History
| Date | Buyer | Sale Price | Title Company |
|---|---|---|---|
| 12 Calebs Ln Rockport | -- | -- | |
| 12 Calebs Ln Rockport | -- | -- | |
| 12 Calebs Ln Rockport | -- | -- | |
| Goodman Nancy | $285,000 | -- | |
| Goodman Nancy | $285,000 | -- |
Source: Public Records
Mortgage History
| Date | Status | Borrower | Loan Amount |
|---|---|---|---|
| Previous Owner | Goodman Nancy | $60,000 | |
| Previous Owner | Goodman Nancy | $113,000 | |
| Previous Owner | Goodman Nancy | $100,000 | |
| Previous Owner | Goodman Nancy | $50,000 |
Source: Public Records
Tax History
| Year | Tax Paid | Tax Assessment Tax Assessment Total Assessment is a certain percentage of the fair market value that is determined by local assessors to be the total taxable value of land and additions on the property. | Land | Improvement |
|---|---|---|---|---|
| 2025 | $7,942 | $906,600 | $418,300 | $488,300 |
| 2024 | $7,548 | $896,400 | $418,300 | $478,100 |
| 2023 | $7,052 | $747,800 | $344,400 | $403,400 |
| 2022 | $6,887 | $701,300 | $348,900 | $352,400 |
| 2021 | $6,424 | $659,500 | $332,200 | $327,300 |
| 2020 | $6,848 | $678,000 | $373,800 | $304,200 |
| 2019 | $6,445 | $653,700 | $365,100 | $288,600 |
| 2018 | $6,345 | $627,600 | $339,000 | $288,600 |
| 2017 | $6,218 | $551,200 | $307,500 | $243,700 |
| 2016 | $6,103 | $542,500 | $298,800 | $243,700 |
Source: Public Records
Map
Nearby Homes
- 4 Norwood Ave
- 2 Mount Pleasant St Unit 3
- 1 High St
- 34R Summer St
- 15 High St Unit D
- 1 Main St Unit R
- 1 Main St Unit C
- 38 & 38R High St
- 20 Main St Unit 12
- 6 Parker St
- 1 Jewett St Unit 2
- 48 Broadway
- 1 Charte Ct
- 15 Beach St
- 5 Smith St Unit R
- 13 Rowe Point
- 5 Boulder Top
- 48 Eden Rd
- 68 Eden Rd
- 175 South St
Your Personal Tour Guide
Ask me questions while you tour the home.