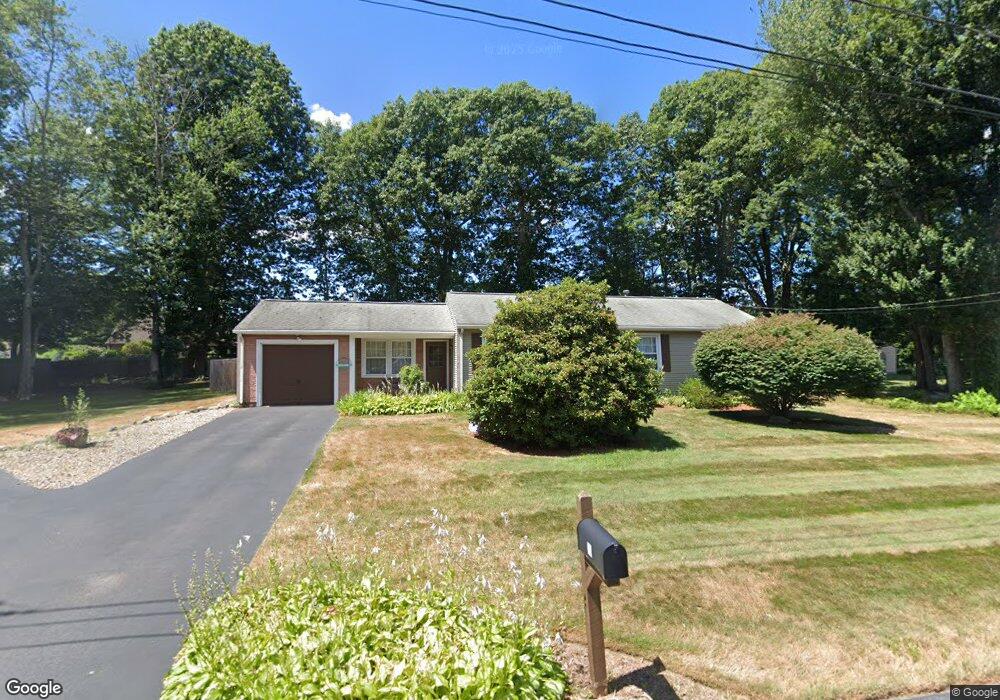
12 Cedar Ln Seekonk, MA 02771
Estimated Value: $484,342 - $597,000
3
Beds
1
Bath
2,136
Sq Ft
$247/Sq Ft
Est. Value
About This Home
This home is located at 12 Cedar Ln, Seekonk, MA 02771 and is currently estimated at $526,586, approximately $246 per square foot. 12 Cedar Ln is a home located in Bristol County with nearby schools including Seekonk High School, Ocean State Montessori School, and St Margaret School.
Ownership History
Date
Name
Owned For
Owner Type
Purchase Details
Closed on
Aug 29, 2003
Sold by
Simonelli Eugene R and Simonelli Deborah A
Bought by
Aguiar Steve R and Aguiar Audrey L
Current Estimated Value
Home Financials for this Owner
Home Financials are based on the most recent Mortgage that was taken out on this home.
Original Mortgage
$218,960
Outstanding Balance
$93,649
Interest Rate
5.69%
Mortgage Type
Purchase Money Mortgage
Estimated Equity
$432,937
Create a Home Valuation Report for This Property
The Home Valuation Report is an in-depth analysis detailing your home's value as well as a comparison with similar homes in the area
Home Values in the Area
Average Home Value in this Area
Purchase History
| Date | Buyer | Sale Price | Title Company |
|---|---|---|---|
| Aguiar Steve R | $273,700 | -- |
Source: Public Records
Mortgage History
| Date | Status | Borrower | Loan Amount |
|---|---|---|---|
| Open | Aguiar Steve R | $218,960 |
Source: Public Records
Tax History
| Year | Tax Paid | Tax Assessment Tax Assessment Total Assessment is a certain percentage of the fair market value that is determined by local assessors to be the total taxable value of land and additions on the property. | Land | Improvement |
|---|---|---|---|---|
| 2025 | $4,783 | $387,300 | $187,100 | $200,200 |
| 2024 | $4,629 | $374,800 | $187,100 | $187,700 |
| 2023 | $4,370 | $333,300 | $167,900 | $165,400 |
| 2022 | $4,035 | $302,500 | $161,000 | $141,500 |
| 2021 | $3,824 | $281,800 | $143,100 | $138,700 |
| 2020 | $3,663 | $278,100 | $142,900 | $135,200 |
| 2019 | $3,457 | $264,700 | $134,300 | $130,400 |
| 2018 | $3,308 | $247,800 | $130,600 | $117,200 |
| 2017 | $3,236 | $240,400 | $127,400 | $113,000 |
| 2016 | $3,210 | $239,400 | $127,400 | $112,000 |
| 2015 | $3,146 | $237,800 | $127,400 | $110,400 |
Source: Public Records
Map
Nearby Homes
Your Personal Tour Guide
Ask me questions while you tour the home.