12 Duke St Lynn, MA 01902
Highlands NeighborhoodEstimated Value: $694,001 - $898,000
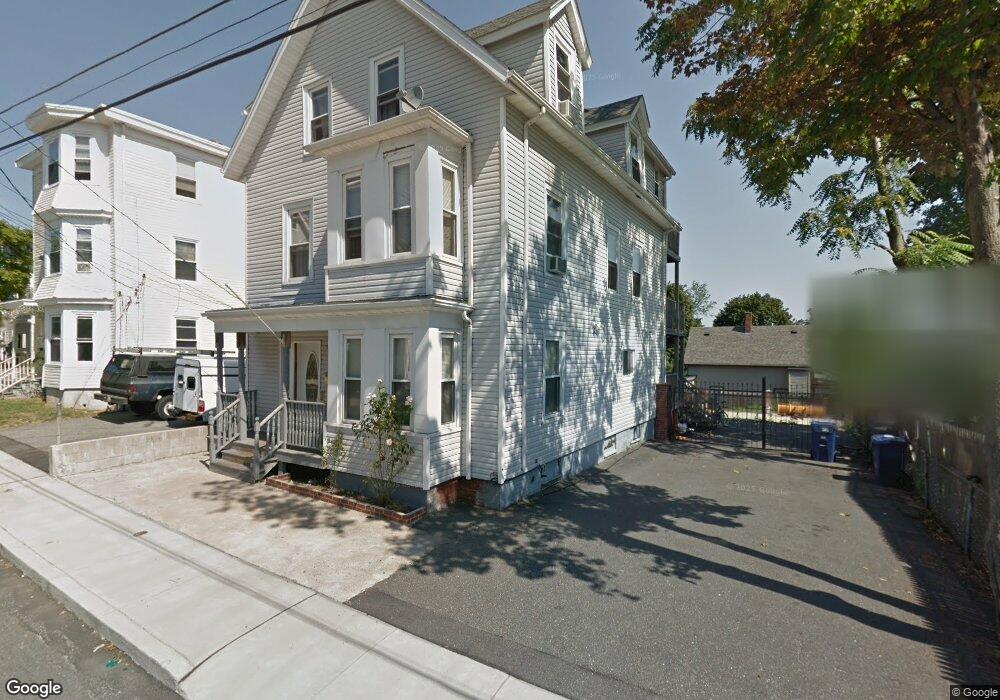
About This Home
This home is located at 12 Duke St, Lynn, MA 01902 and is currently estimated at $769,000, approximately $328 per square foot. 12 Duke St is a home located in Essex County with nearby schools including Robert L. Ford Elementary School, William R. Fallon School, and Marshall Middle School.
Ownership History
We collect this data history from publicly available records. To have your information removed, we recommend requesting removal directly through your county’s website.
Purchase Details
Home Financials for this Owner
Home Financials are based on the most recent Mortgage that was taken out on this home.Purchase Details
Purchase Details
Home Values in the Area
Average Home Value in this Area
Purchase History
We collect this data history from publicly available records. To have your information removed, we recommend requesting removal directly through your county’s website.
| Date | Buyer | Sale Price | Title Company |
|---|---|---|---|
| $285,000 | -- | ||
| $285,000 | -- | ||
| $95,900 | -- | ||
| $95,900 | -- | ||
| $65,000 | -- | ||
| $65,000 | -- |
Mortgage History
We collect this data history from publicly available records. To have your information removed, we recommend requesting removal directly through your county’s website.
| Date | Status | Borrower | Loan Amount |
|---|---|---|---|
| Open | $305,000 | ||
| Closed | $242,250 |
Tax History
We collect this data history from publicly available records. To have your information removed, we recommend requesting removal directly through your county’s website.
| Year | Tax Paid | Tax Assessment Tax Assessment Total Assessment is a certain percentage of the fair market value that is determined by local assessors to be the total taxable value of land and additions on the property. | Land | Improvement |
|---|---|---|---|---|
| 2025 | $7,670 | $740,300 | $202,100 | $538,200 |
| 2024 | $7,527 | $714,800 | $182,400 | $532,400 |
| 2023 | $7,341 | $658,400 | $182,400 | $476,000 |
| 2022 | $7,247 | $583,000 | $156,600 | $426,400 |
| 2021 | $6,837 | $524,700 | $136,000 | $388,700 |
| 2020 | $6,220 | $464,200 | $106,300 | $357,900 |
| 2019 | $6,125 | $428,300 | $103,700 | $324,600 |
| 2018 | $5,705 | $376,600 | $100,200 | $276,400 |
| 2017 | $5,316 | $340,800 | $77,900 | $262,900 |
| 2016 | $4,869 | $300,900 | $65,600 | $235,300 |
| 2015 | $4,501 | $268,700 | $66,900 | $201,800 |
Map
- 28-30 Hollingsworth St
- 111 Adams St
- 31-33 Hollingsworth St
- 6 Rockaway Ct
- 12 Eade St
- 12 Adams St
- 50-52 Allen Ave
- 115 Collins St
- 5 Morrill Place
- 17 Acorn St
- 57 Allen Ave
- 343 Essex St
- 209 Fayette St
- 38 High Rock St
- 43 High Rock St
- 51 High Rock St
- 75 Collins St
- 10 Essex Ct
- 48 High Rock St Unit 1
- 28 Hawthorne St
Ask me questions while you tour the home.