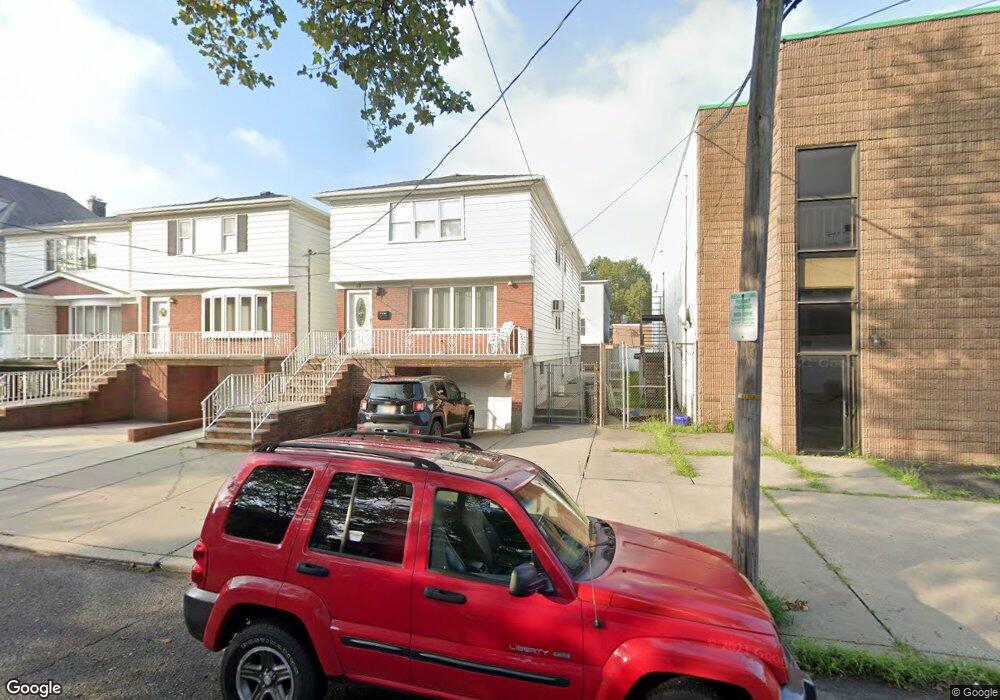
12 E 38th St Bayonne, NJ 07002
North Bayonne NeighborhoodEstimated Value: $721,396 - $924,000
Studio
--
Bath
2,244
Sq Ft
$372/Sq Ft
Est. Value
About This Home
This home is located at 12 E 38th St, Bayonne, NJ 07002 and is currently estimated at $833,849, approximately $371 per square foot. 12 E 38th St is a home located in Hudson County with nearby schools including Bayonne High School and Phillips Global Institute.
Ownership History
Date
Name
Owned For
Owner Type
Purchase Details
Closed on
Mar 8, 2007
Sold by
Wojciechowski Anna
Bought by
Lee Mary
Current Estimated Value
Home Financials for this Owner
Home Financials are based on the most recent Mortgage that was taken out on this home.
Original Mortgage
$250,000
Outstanding Balance
$151,900
Interest Rate
6.33%
Mortgage Type
Purchase Money Mortgage
Estimated Equity
$681,949
Create a Home Valuation Report for This Property
The Home Valuation Report is an in-depth analysis detailing your home's value as well as a comparison with similar homes in the area
Home Values in the Area
Average Home Value in this Area
Purchase History
| Date | Buyer | Sale Price | Title Company |
|---|---|---|---|
| Lee Mary | $500,000 | All Jersey Title Llc |
Source: Public Records
Mortgage History
| Date | Status | Borrower | Loan Amount |
|---|---|---|---|
| Open | Lee Mary | $250,000 |
Source: Public Records
Tax History
| Year | Tax Paid | Tax Assessment Tax Assessment Total Assessment is a certain percentage of the fair market value that is determined by local assessors to be the total taxable value of land and additions on the property. | Land | Improvement |
|---|---|---|---|---|
| 2025 | $12,568 | $449,500 | $178,100 | $271,400 |
| 2024 | $12,060 | $449,500 | $178,100 | $271,400 |
| 2023 | $12,060 | $449,500 | $178,100 | $271,400 |
| 2022 | $11,835 | $449,500 | $178,100 | $271,400 |
| 2021 | $11,741 | $449,500 | $178,100 | $271,400 |
| 2020 | $11,534 | $449,500 | $178,100 | $271,400 |
| 2019 | $13,446 | $155,800 | $75,000 | $80,800 |
| 2018 | $13,178 | $155,800 | $75,000 | $80,800 |
| 2017 | $12,836 | $155,800 | $75,000 | $80,800 |
| 2016 | $12,363 | $155,800 | $75,000 | $80,800 |
| 2015 | $11,956 | $155,800 | $75,000 | $80,800 |
| 2014 | $11,599 | $155,800 | $75,000 | $80,800 |
Source: Public Records
Map
Nearby Homes
Your Personal Tour Guide
Ask me questions while you tour the home.