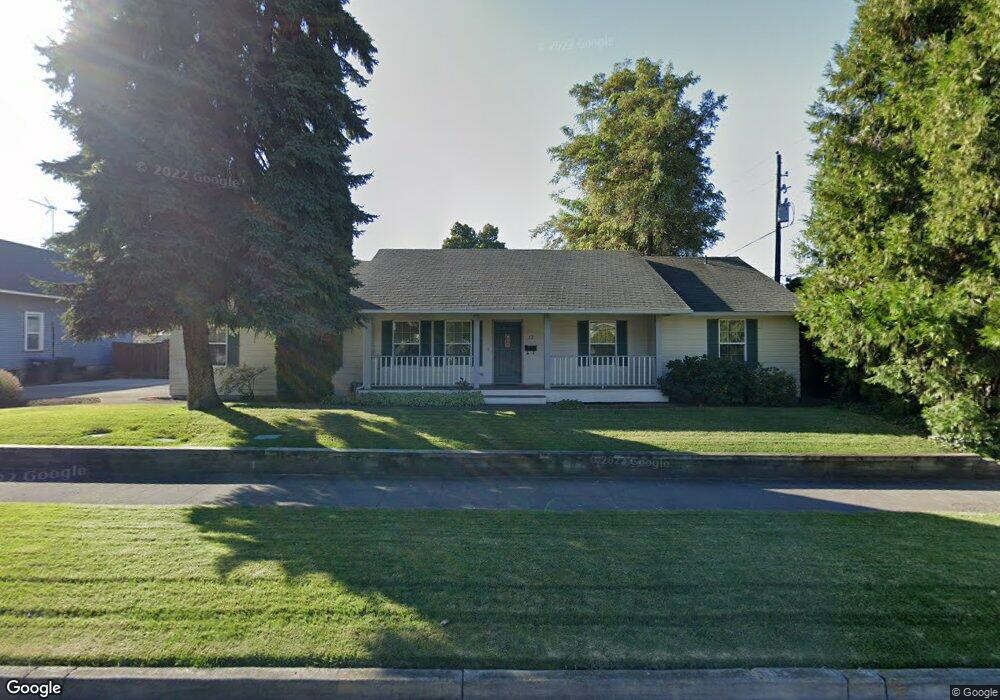
12 E Chestnut St Walla Walla, WA 99362
Estimated Value: $323,000 - $421,000
3
Beds
2
Baths
1,437
Sq Ft
$253/Sq Ft
Est. Value
About This Home
This home is located at 12 E Chestnut St, Walla Walla, WA 99362 and is currently estimated at $363,445, approximately $252 per square foot. 12 E Chestnut St is a home located in Walla Walla County with nearby schools including Sharpstein Elementary School, Garrison Middle School, and Willow Public School.
Ownership History
Date
Name
Owned For
Owner Type
Purchase Details
Closed on
Apr 29, 2015
Sold by
Rieckmann William H and Rieckmann Michal S
Bought by
Patterson John F
Current Estimated Value
Home Financials for this Owner
Home Financials are based on the most recent Mortgage that was taken out on this home.
Original Mortgage
$128,000
Outstanding Balance
$45,358
Interest Rate
3.73%
Mortgage Type
New Conventional
Estimated Equity
$318,087
Create a Home Valuation Report for This Property
The Home Valuation Report is an in-depth analysis detailing your home's value as well as a comparison with similar homes in the area
Purchase History
| Date | Buyer | Sale Price | Title Company |
|---|---|---|---|
| Patterson John F | $160,000 | Walla Walla Title Company |
Source: Public Records
Mortgage History
| Date | Status | Borrower | Loan Amount |
|---|---|---|---|
| Open | Patterson John F | $128,000 |
Source: Public Records
Tax History
| Year | Tax Paid | Tax Assessment Tax Assessment Total Assessment is a certain percentage of the fair market value that is determined by local assessors to be the total taxable value of land and additions on the property. | Land | Improvement |
|---|---|---|---|---|
| 2025 | $3,256 | $330,070 | $60,980 | $269,090 |
| 2024 | $2,795 | $328,810 | $49,900 | $278,910 |
| 2023 | $2,795 | $315,530 | $49,900 | $265,630 |
| 2022 | $2,819 | $293,170 | $40,190 | $252,980 |
| 2021 | $2,294 | $260,170 | $40,190 | $219,980 |
| 2020 | $2,268 | $191,900 | $40,190 | $151,710 |
| 2019 | $1,787 | $191,900 | $40,190 | $151,710 |
| 2018 | $2,102 | $165,320 | $37,000 | $128,320 |
| 2017 | $1,949 | $159,210 | $37,000 | $122,210 |
| 2016 | $2,048 | $159,210 | $37,000 | $122,210 |
| 2015 | $1,864 | $159,210 | $37,000 | $122,210 |
| 2014 | -- | $148,100 | $37,000 | $111,100 |
| 2013 | -- | $148,100 | $37,000 | $111,100 |
Source: Public Records
Map
Nearby Homes
- 564 S 1st Ave
- 123 E Maple St
- 15 Eagan St
- 444 S 4th Ave
- 201 Malcolm St
- 385 S 1st Ave
- 249 Eagan St
- 364 Catherine St Unit F9
- 1203 S 3rd Ave
- 332 L St
- 130 Dice Place
- 399 S Palouse St Unit 1
- 366 S Palouse St
- 311 Chase Ave
- 434 Sprague St
- 516 Liberty St
- 503 Clay St
- 1390 S 3rd Ave
- 309 E Birch St
- 444 Washington St
Your Personal Tour Guide
Ask me questions while you tour the home.