12 Ferriter St Quincy, MA 02169
Estimated Value: $905,000 - $1,045,000
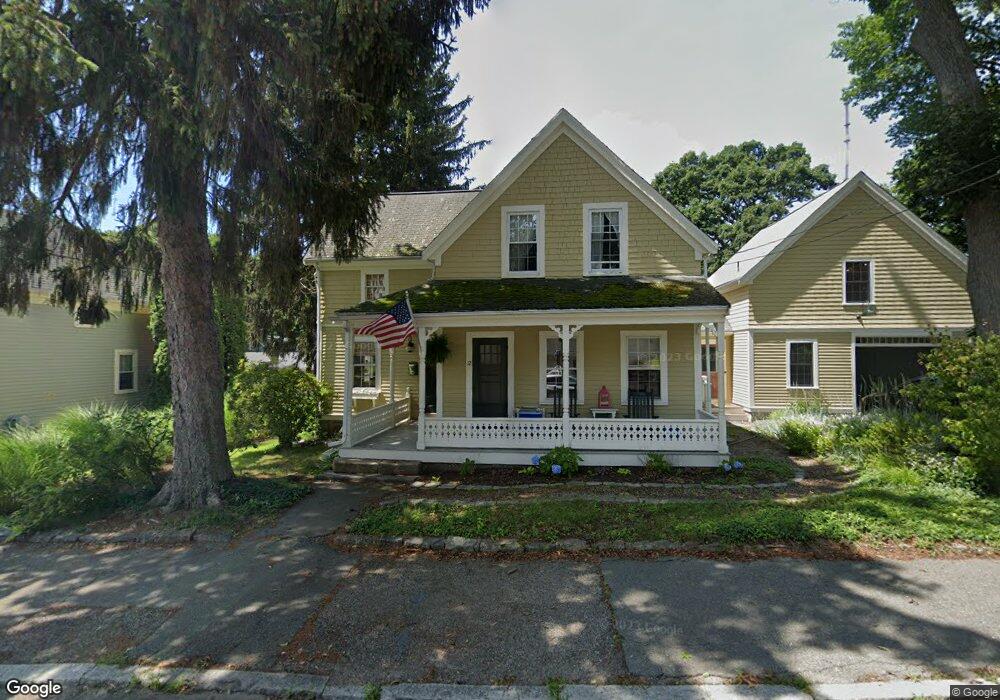
About This Home
This home is located at 12 Ferriter St, Quincy, MA 02169 and is currently estimated at $972,802, approximately $396 per square foot. 12 Ferriter St is a home located in Norfolk County with nearby schools including Montclair Elementary School, Atlantic Middle School, and North Quincy High School.
Ownership History
We collect this data history from publicly available records. To have your information removed, we recommend requesting removal directly through your county’s website.
Purchase Details
Home Financials for this Owner
Home Financials are based on the most recent Mortgage that was taken out on this home.Purchase History
We collect this data history from publicly available records. To have your information removed, we recommend requesting removal directly through your county’s website.
| Date | Buyer | Sale Price | Title Company |
|---|---|---|---|
| $115,000 | -- |
Mortgage History
We collect this data history from publicly available records. To have your information removed, we recommend requesting removal directly through your county’s website.
| Date | Status | Borrower | Loan Amount |
|---|---|---|---|
| Open | $86,250 |
Tax History
We collect this data history from publicly available records. To have your information removed, we recommend requesting removal directly through your county’s website.
| Year | Tax Paid | Tax Assessment Tax Assessment Total Assessment is a certain percentage of the fair market value that is determined by local assessors to be the total taxable value of land and additions on the property. | Land | Improvement |
|---|---|---|---|---|
| 2025 | $9,316 | $808,000 | $323,600 | $484,400 |
| 2024 | $8,731 | $774,700 | $308,800 | $465,900 |
| 2023 | $8,192 | $736,000 | $294,700 | $441,300 |
| 2022 | $8,360 | $697,800 | $238,000 | $459,800 |
| 2021 | $7,833 | $645,200 | $238,000 | $407,200 |
| 2020 | $7,959 | $640,300 | $238,000 | $402,300 |
| 2019 | $7,809 | $622,200 | $231,500 | $390,700 |
| 2018 | $7,562 | $566,900 | $215,200 | $351,700 |
| 2017 | $7,526 | $531,100 | $205,500 | $325,600 |
| 2016 | $6,989 | $486,700 | $187,900 | $298,800 |
| 2015 | $6,583 | $450,900 | $177,900 | $273,000 |
| 2014 | $6,301 | $424,000 | $177,900 | $246,100 |
Map
- 141 Gardiner Rd
- 76 Shawmut St
- 159 Willard St Unit 7
- 141 Willard St Unit 8
- 580 Quarry St Unit 4
- 580 Quarry St Unit 18
- 230 Willard St Unit 602
- 94 Grafton Ave
- 45 Foster Ln
- 328 Copeland St Unit 2D
- 440 Granite Ave Unit 201
- 40 Shirley St
- 635 Adams St
- 17 Duggan Ln
- 7 Phyllis Ln
- 25 Waldeck Rd
- 211 Copeland St
- 73 Washington St
- 114 Bunker Hill Ln
- 20 Miller St Unit 2
Ask me questions while you tour the home.