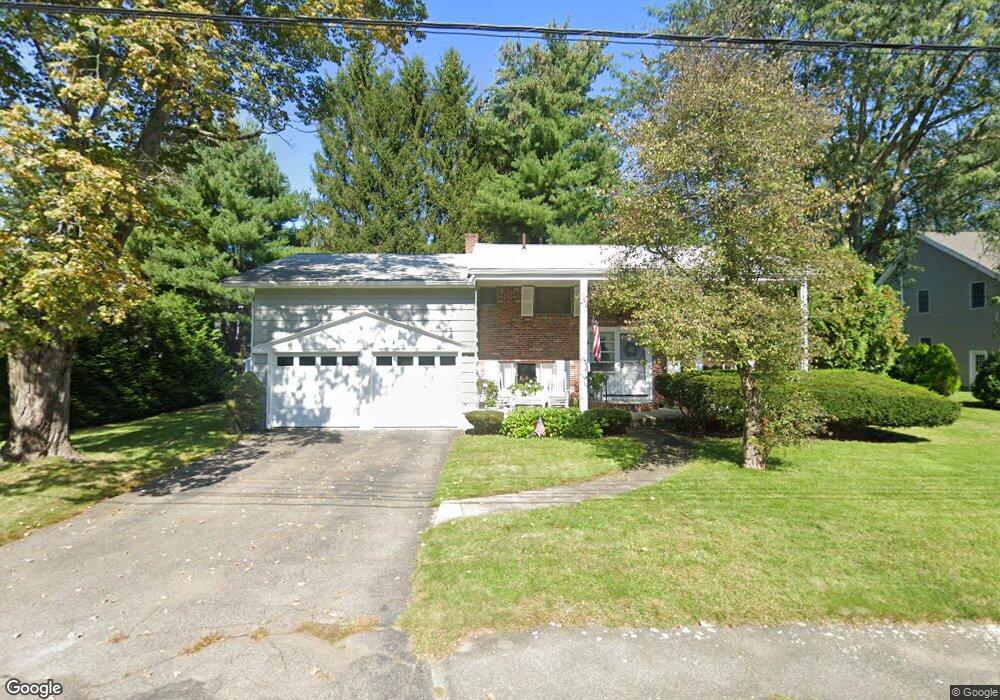
12 Fletcher Rd Needham, MA 02492
Estimated Value: $1,071,000 - $1,455,061
4
Beds
2
Baths
940
Sq Ft
$1,370/Sq Ft
Est. Value
About This Home
This home is located at 12 Fletcher Rd, Needham, MA 02492 and is currently estimated at $1,287,515, approximately $1,369 per square foot. 12 Fletcher Rd is a home located in Norfolk County with nearby schools including Newman Elementary School, High Rock Middle School, and Pollard Middle School.
Ownership History
Date
Name
Owned For
Owner Type
Purchase Details
Closed on
Nov 3, 1975
Bought by
Robey Philip and Robey Alice E
Current Estimated Value
Create a Home Valuation Report for This Property
The Home Valuation Report is an in-depth analysis detailing your home's value as well as a comparison with similar homes in the area
Home Values in the Area
Average Home Value in this Area
Purchase History
We collect this data history from publicly available records. To have your information removed, we recommend requesting removal directly through your county’s website.
| Date | Buyer | Sale Price | Title Company |
|---|---|---|---|
| Robey Philip | $54,000 | -- |
Source: Public Records
Mortgage History
We collect this data history from publicly available records. To have your information removed, we recommend requesting removal directly through your county’s website.
| Date | Status | Borrower | Loan Amount |
|---|---|---|---|
| Open | Robey Philip | $181,000 | |
| Closed | Robey Philip | $185,000 |
Source: Public Records
Tax History
| Year | Tax Paid | Tax Assessment Tax Assessment Total Assessment is a certain percentage of the fair market value that is determined by local assessors to be the total taxable value of land and additions on the property. | Land | Improvement |
|---|---|---|---|---|
| 2025 | $9,689 | $914,100 | $764,700 | $149,400 |
| 2024 | $8,873 | $708,700 | $535,600 | $173,100 |
| 2023 | $9,068 | $695,400 | $535,600 | $159,800 |
| 2022 | $8,684 | $649,500 | $496,400 | $153,100 |
| 2021 | $8,463 | $649,500 | $496,400 | $153,100 |
| 2020 | $8,211 | $657,400 | $496,400 | $161,000 |
| 2019 | $7,550 | $609,400 | $451,900 | $157,500 |
| 2018 | $7,240 | $609,400 | $451,900 | $157,500 |
| 2017 | $7,004 | $589,100 | $451,900 | $137,200 |
| 2016 | $6,822 | $591,200 | $451,900 | $139,300 |
| 2015 | $6,675 | $591,200 | $451,900 | $139,300 |
| 2014 | $6,758 | $580,600 | $411,400 | $169,200 |
Source: Public Records
Map
Nearby Homes
- 456 Chestnut St
- 64 Gayland Rd
- 46 Howland St Unit 46
- 957 South St
- 105 Blake St
- 20 Burr Dr
- 72 Marked Tree Rd
- 238 Harris Ave
- 5 Colonial Rd
- 131 Fair Oaks Park
- 19 Marked Tree Rd
- 11 Mayo Ave
- 4 Wilson's Way
- 620 High Rock St
- 1360 Great Plain Ave
- 1362 Great Plain Ave Unit 1
- 19 Oakland Ave Unit 19
- 19 Oakland Ave
- 34 Pond St
- 8 Crestview Rd
- 24 Fletcher Rd
- 540 Chestnut St
- 548 Chestnut St
- 15 Fletcher Rd
- 27 Lantern Ln
- 558 Chestnut St
- 33 Lantern Ln
- 530 Chestnut St
- 30 Fletcher Rd
- 23 Fletcher Rd
- 564 Chestnut St
- 19 Lantern Ln
- 39 Lantern Ln
- 27 Fletcher Rd
- 549 Chestnut St
- 543 Chestnut St
- 557 Chestnut St
- 520 Chestnut St
- 129 High Rock St
- 537 Chestnut St
Your Personal Tour Guide
Ask me questions while you tour the home.