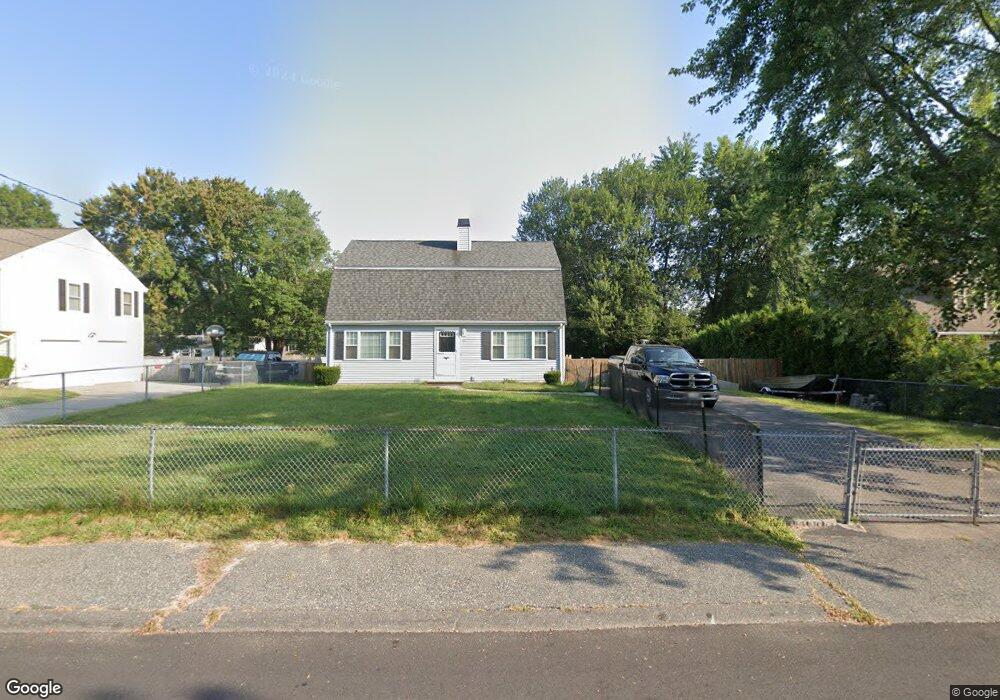
12 Florence St Bellingham, MA 02019
Estimated Value: $431,006 - $535,000
3
Beds
2
Baths
1,428
Sq Ft
$335/Sq Ft
Est. Value
About This Home
This home is located at 12 Florence St, Bellingham, MA 02019 and is currently estimated at $478,502, approximately $335 per square foot. 12 Florence St is a home located in Norfolk County with nearby schools including Joseph F. DiPietro Elementary, Bellingham High School, and Bethany Christian Academy.
Ownership History
Date
Name
Owned For
Owner Type
Purchase Details
Closed on
Nov 15, 1990
Sold by
Silver Hgts Dev Corp
Bought by
Rockland Fcu
Current Estimated Value
Home Financials for this Owner
Home Financials are based on the most recent Mortgage that was taken out on this home.
Original Mortgage
$71,250
Interest Rate
10.03%
Mortgage Type
Purchase Money Mortgage
Create a Home Valuation Report for This Property
The Home Valuation Report is an in-depth analysis detailing your home's value as well as a comparison with similar homes in the area
Home Values in the Area
Average Home Value in this Area
Purchase History
| Date | Buyer | Sale Price | Title Company |
|---|---|---|---|
| Rockland Fcu | $75,000 | -- | |
| Rockland Fcu | $75,000 | -- |
Source: Public Records
Mortgage History
| Date | Status | Borrower | Loan Amount |
|---|---|---|---|
| Open | Rockland Fcu | $90,000 | |
| Closed | Rockland Fcu | $71,250 |
Source: Public Records
Tax History
| Year | Tax Paid | Tax Assessment Tax Assessment Total Assessment is a certain percentage of the fair market value that is determined by local assessors to be the total taxable value of land and additions on the property. | Land | Improvement |
|---|---|---|---|---|
| 2025 | $4,086 | $325,300 | $164,800 | $160,500 |
| 2024 | $3,881 | $301,800 | $150,500 | $151,300 |
| 2023 | $3,743 | $286,800 | $143,300 | $143,500 |
| 2022 | $3,593 | $255,200 | $119,500 | $135,700 |
| 2021 | $3,517 | $244,100 | $119,500 | $124,600 |
| 2020 | $3,353 | $235,800 | $119,500 | $116,300 |
| 2019 | $3,291 | $231,600 | $119,500 | $112,100 |
| 2018 | $3,065 | $212,700 | $114,900 | $97,800 |
| 2017 | $2,993 | $208,700 | $114,900 | $93,800 |
| 2016 | $2,869 | $200,800 | $113,000 | $87,800 |
| 2015 | $2,750 | $193,000 | $108,600 | $84,400 |
| 2014 | $2,759 | $188,200 | $106,100 | $82,100 |
Source: Public Records
Map
Nearby Homes
- 21 Dorothy Ave
- 31 Lilac Ave
- 67 Blackstone St
- 7 Debra Ln Unit 1
- 0 North St Unit 73440626
- 62 North St
- 1 Whitman Cir Unit 1
- 3 Whitman Cir Unit 3
- 11 Whitman Cir Unit 11
- 3301 Maple Brook Rd
- 241 Prospect St
- 138 North St
- 7 Palmetto Dr Unit 7
- 1 Toni Dr
- 123-125 Mendon St
- 31 Whitehall Way
- 85 Mendon St
- 11 Quail Run Rd
- 133 Lakeshore Dr
- 2 Spring St
Your Personal Tour Guide
Ask me questions while you tour the home.