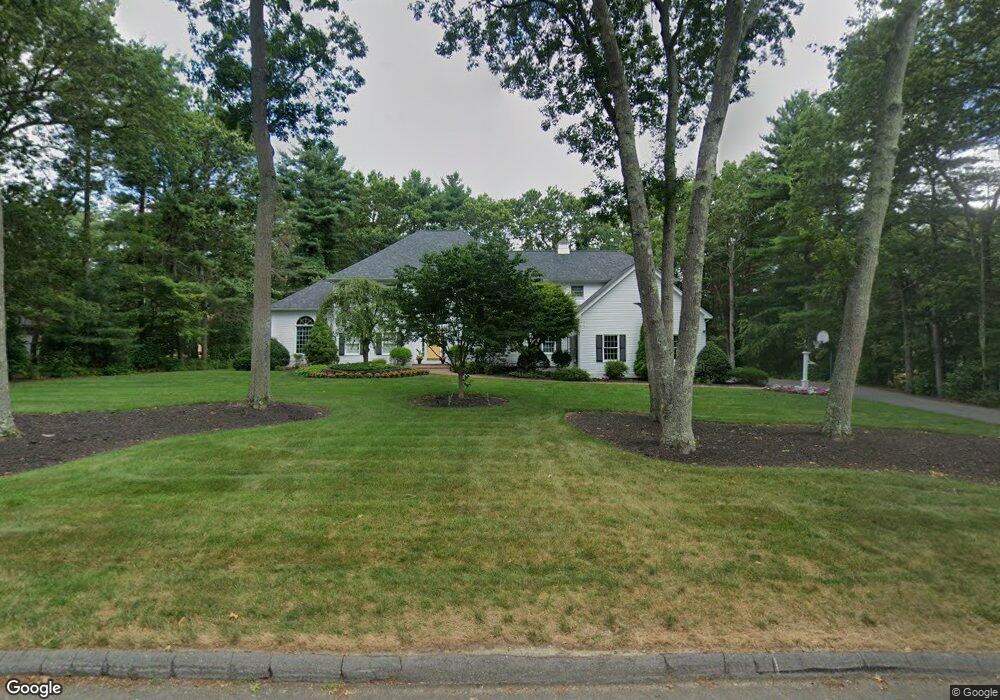
12 Gary Rd Foxboro, MA 02035
Estimated Value: $1,224,555 - $1,438,000
4
Beds
4
Baths
4,371
Sq Ft
$299/Sq Ft
Est. Value
About This Home
This home is located at 12 Gary Rd, Foxboro, MA 02035 and is currently estimated at $1,308,389, approximately $299 per square foot. 12 Gary Rd is a home located in Norfolk County with nearby schools including Foxborough High School, Foxborough Regional Charter School, and Hands-On-Montessori School.
Ownership History
Date
Name
Owned For
Owner Type
Purchase Details
Closed on
Jun 28, 1995
Sold by
Nordini Bros Construct
Bought by
Landry Robert R and Landry Kathleen M
Current Estimated Value
Home Financials for this Owner
Home Financials are based on the most recent Mortgage that was taken out on this home.
Original Mortgage
$300,000
Interest Rate
7.8%
Mortgage Type
Purchase Money Mortgage
Create a Home Valuation Report for This Property
The Home Valuation Report is an in-depth analysis detailing your home's value as well as a comparison with similar homes in the area
Home Values in the Area
Average Home Value in this Area
Purchase History
| Date | Buyer | Sale Price | Title Company |
|---|---|---|---|
| Landry Robert R | $420,000 | -- |
Source: Public Records
Mortgage History
| Date | Status | Borrower | Loan Amount |
|---|---|---|---|
| Open | Landry Robert R | $50,000 | |
| Closed | Landry Robert R | $28,000 | |
| Closed | Landry Robert R | $300,000 |
Source: Public Records
Tax History
| Year | Tax Paid | Tax Assessment Tax Assessment Total Assessment is a certain percentage of the fair market value that is determined by local assessors to be the total taxable value of land and additions on the property. | Land | Improvement |
|---|---|---|---|---|
| 2025 | $15,184 | $1,148,600 | $314,700 | $833,900 |
| 2024 | $14,349 | $1,062,100 | $288,500 | $773,600 |
| 2023 | $13,637 | $959,700 | $274,900 | $684,800 |
| 2022 | $13,341 | $918,800 | $256,600 | $662,200 |
| 2021 | $13,290 | $901,600 | $250,100 | $651,500 |
| 2020 | $12,822 | $880,000 | $250,100 | $629,900 |
| 2019 | $12,582 | $855,900 | $269,100 | $586,800 |
| 2018 | $12,387 | $850,200 | $279,500 | $570,700 |
| 2017 | $12,088 | $803,700 | $270,800 | $532,900 |
| 2016 | $12,013 | $810,600 | $266,100 | $544,500 |
| 2015 | $11,921 | $784,800 | $212,800 | $572,000 |
| 2014 | $11,599 | $773,800 | $212,800 | $561,000 |
Source: Public Records
Map
Nearby Homes
Your Personal Tour Guide
Ask me questions while you tour the home.