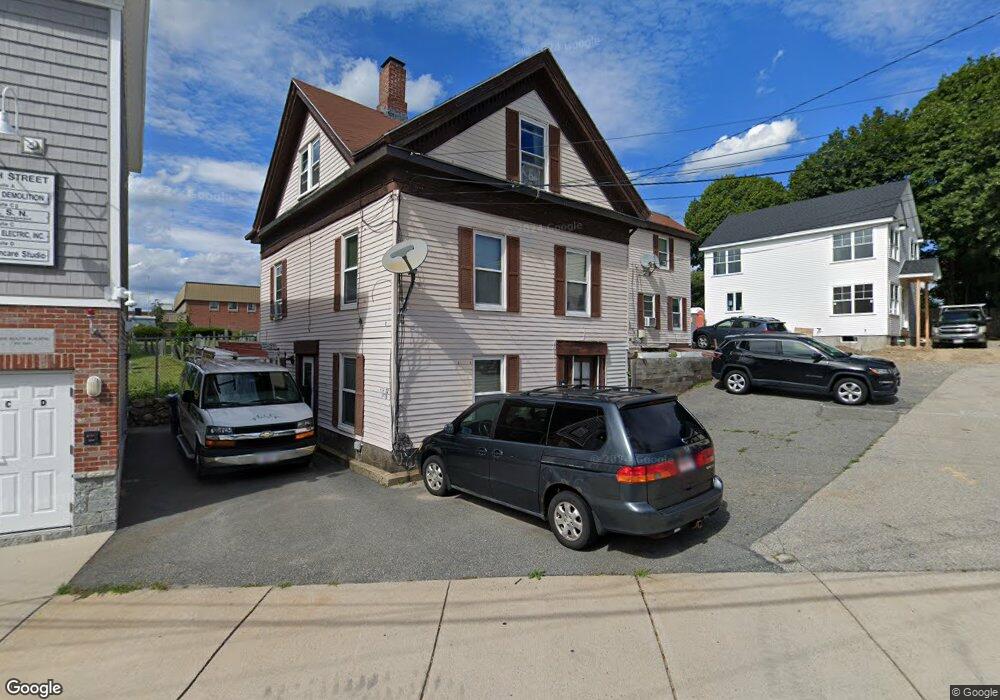
12 High St Woburn, MA 01801
Downtown Woburn NeighborhoodEstimated Value: $686,000 - $873,000
6
Beds
3
Baths
2,128
Sq Ft
$354/Sq Ft
Est. Value
About This Home
This home is located at 12 High St, Woburn, MA 01801 and is currently estimated at $753,333, approximately $354 per square foot. 12 High St is a home located in Middlesex County with nearby schools including Shamrock Elementary School, Daniel L. Joyce Middle School, and Woburn High School.
Ownership History
Date
Name
Owned For
Owner Type
Purchase Details
Closed on
May 24, 2023
Sold by
Collins Bryan P and Collins Christopher J
Bought by
Innitou Rt and Collins
Current Estimated Value
Purchase Details
Closed on
Mar 25, 2019
Sold by
Innitou Rt and Collins
Bought by
Collins Jacqueline M and Collins Jacqueline M
Create a Home Valuation Report for This Property
The Home Valuation Report is an in-depth analysis detailing your home's value as well as a comparison with similar homes in the area
Home Values in the Area
Average Home Value in this Area
Purchase History
| Date | Buyer | Sale Price | Title Company |
|---|---|---|---|
| Innitou Rt | -- | None Available | |
| Innitou Rt | -- | None Available | |
| Collins Jacqueline M | -- | -- | |
| Collins Bryan P | -- | -- | |
| Collins Bryan P | -- | -- | |
| Collins Peter D | -- | -- | |
| Collins Jacqueline M | -- | -- |
Source: Public Records
Tax History
| Year | Tax Paid | Tax Assessment Tax Assessment Total Assessment is a certain percentage of the fair market value that is determined by local assessors to be the total taxable value of land and additions on the property. | Land | Improvement |
|---|---|---|---|---|
| 2025 | $5,257 | $615,600 | $235,000 | $380,600 |
| 2024 | $4,792 | $594,600 | $223,800 | $370,800 |
| 2023 | $4,859 | $558,500 | $203,400 | $355,100 |
| 2022 | $4,493 | $481,000 | $176,900 | $304,100 |
| 2021 | $4,409 | $472,600 | $168,500 | $304,100 |
| 2020 | $3,857 | $413,800 | $168,500 | $245,300 |
| 2019 | $3,519 | $370,400 | $160,400 | $210,000 |
| 2018 | $3,402 | $344,000 | $147,200 | $196,800 |
| 2017 | $3,311 | $333,100 | $140,200 | $192,900 |
| 2016 | $3,138 | $312,200 | $131,000 | $181,200 |
| 2015 | $3,089 | $303,700 | $122,500 | $181,200 |
| 2014 | $3,047 | $291,900 | $122,500 | $169,400 |
Source: Public Records
Map
Nearby Homes
- 7 Prospect St
- 31 Montvale Ave Unit 2
- 35 Montvale Ave Unit 8
- 28 Everett St
- 52 Pleasant St
- 477 Main St
- 6 Highland St
- 39 Jefferson Ave
- 21 Eastern Ave
- 27 Arlington Rd Unit 2
- 29 Arlington Rd Unit 3-2
- 29 Arlington Rd Unit 1-1
- 29 Arlington Rd Unit 5
- 31 Arlington Rd Unit 1-6
- 0 Mount Pleasant St
- 66 Salem St
- 3 Golden Terrace
- 555 Main St Unit 11
- 18 Church St Unit 2
- 26 Flagg St
- 10 High St Unit 1
- 10 High St
- 14 High St
- 16 High St
- 16A High St Unit A
- 18 High St
- 18 Buel Place Unit 18
- 3 Prospect Ave
- 9 Prospect St
- 9 Prospect St Unit 309
- 17 Buel Place
- 3 Prospect St
- 1 Prospect Ave
- 14 Buel Place Unit 1
- 14 Buel Place Unit 2
- 11 Prospect St
- 307 Main St
- 307 Main St
- 307 Main St Unit 4
- 307 Main St Unit 7
Your Personal Tour Guide
Ask me questions while you tour the home.