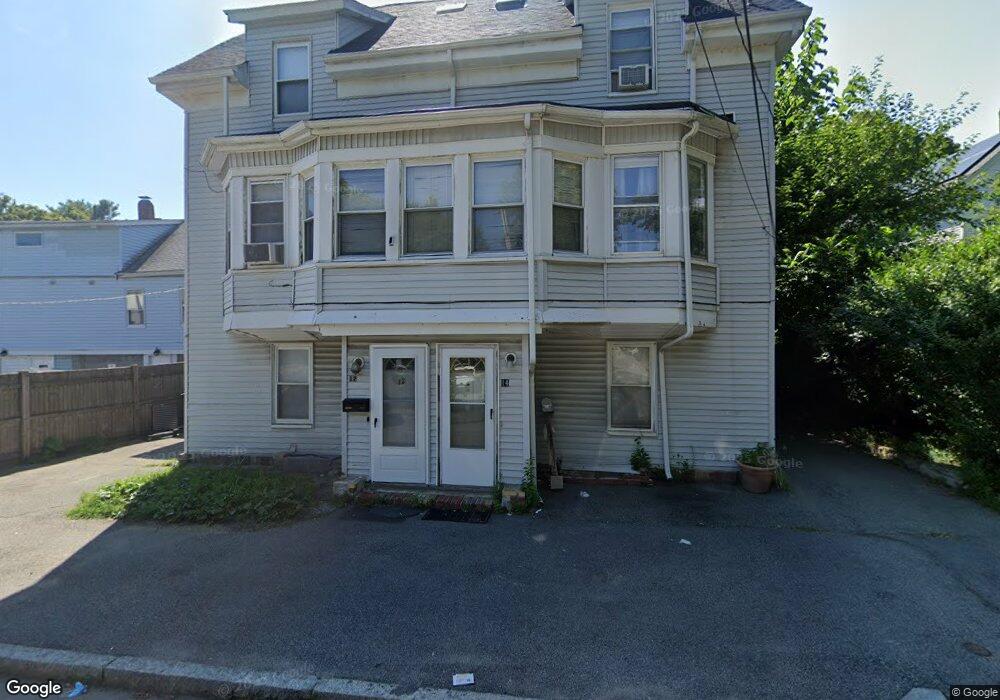
12 Prout St Quincy, MA 02169
South Quincy NeighborhoodEstimated Value: $831,434 - $944,000
7
Beds
3
Baths
2,540
Sq Ft
$350/Sq Ft
Est. Value
About This Home
This home is located at 12 Prout St, Quincy, MA 02169 and is currently estimated at $888,109, approximately $349 per square foot. 12 Prout St is a home located in Norfolk County with nearby schools including Lincoln-Hancock Community School, South West Middle School, and Quincy High School.
Ownership History
Date
Name
Owned For
Owner Type
Purchase Details
Closed on
Dec 24, 2012
Sold by
Barbosa Orlando and Barbosa Idelmira
Bought by
Barbosa Orlando
Current Estimated Value
Purchase Details
Closed on
Jun 1, 2000
Sold by
Ha For M
Bought by
Barbosa Orlando and Barbosa Idelmina
Purchase Details
Closed on
Sep 19, 1997
Sold by
Medua Oscar G and Medua Therese R
Bought by
Ha For M
Create a Home Valuation Report for This Property
The Home Valuation Report is an in-depth analysis detailing your home's value as well as a comparison with similar homes in the area
Home Values in the Area
Average Home Value in this Area
Purchase History
| Date | Buyer | Sale Price | Title Company |
|---|---|---|---|
| Barbosa Orlando | $20,000 | -- | |
| Barbosa Orlando | $245,000 | -- | |
| Ha For M | $120,000 | -- | |
| Ha For M | $120,000 | -- |
Source: Public Records
Mortgage History
| Date | Status | Borrower | Loan Amount |
|---|---|---|---|
| Previous Owner | Ha For M | $38,500 | |
| Previous Owner | Ha For M | $300,000 |
Source: Public Records
Tax History
| Year | Tax Paid | Tax Assessment Tax Assessment Total Assessment is a certain percentage of the fair market value that is determined by local assessors to be the total taxable value of land and additions on the property. | Land | Improvement |
|---|---|---|---|---|
| 2025 | $8,606 | $746,400 | $267,500 | $478,900 |
| 2024 | $8,116 | $720,100 | $254,700 | $465,400 |
| 2023 | $7,758 | $697,000 | $231,600 | $465,400 |
| 2022 | $7,753 | $647,200 | $193,000 | $454,200 |
| 2021 | $7,210 | $593,900 | $193,000 | $400,900 |
| 2020 | $7,514 | $604,500 | $193,000 | $411,500 |
| 2019 | $6,616 | $527,200 | $182,100 | $345,100 |
| 2018 | $6,355 | $476,400 | $168,600 | $307,800 |
| 2017 | $6,558 | $462,800 | $160,500 | $302,300 |
| 2016 | $5,761 | $401,200 | $139,600 | $261,600 |
| 2015 | $5,647 | $386,800 | $139,600 | $247,200 |
| 2014 | $4,801 | $323,100 | $139,600 | $183,500 |
Source: Public Records
Map
Nearby Homes
- 21 Arthur St
- 91 Garfield St
- 12 Nelson St
- 132 Centre St
- 52 Packards Ln Unit 4
- 59 Packards Ln Unit 5
- 59 Packards Ln Unit 1
- 59 Packards Ln Unit 3
- 79 Gilbert St
- 1 Cityview Ln Unit 707
- 9 Westford St
- 211 Copeland St
- 84 West St Unit 1
- 165 Whitwell St
- 171-175 Granite St
- 40 Cross St Unit 1
- 39 Cross St
- 87 Village Dr
- 51 Branch St Unit 3
- 293 Whitwell St
Your Personal Tour Guide
Ask me questions while you tour the home.