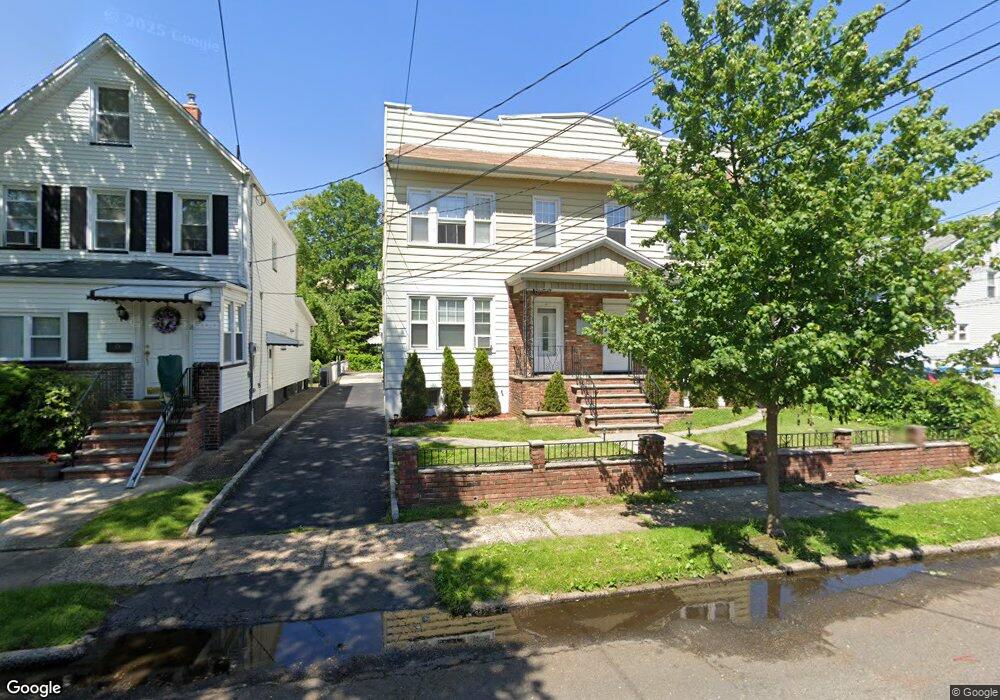
12 Race St Unit 2 Nutley, NJ 07110
Estimated Value: $330,000 - $423,000
Studio
--
Bath
1,083
Sq Ft
$345/Sq Ft
Est. Value
About This Home
This home is located at 12 Race St Unit 2, Nutley, NJ 07110 and is currently estimated at $373,544, approximately $344 per square foot. 12 Race St Unit 2 is a home located in Essex County with nearby schools including Nutley High School and Good Shepherd Academy.
Ownership History
Date
Name
Owned For
Owner Type
Purchase Details
Closed on
May 25, 2022
Sold by
Oneill Brian P
Bought by
Sampson Devon
Current Estimated Value
Home Financials for this Owner
Home Financials are based on the most recent Mortgage that was taken out on this home.
Original Mortgage
$261,000
Outstanding Balance
$247,944
Interest Rate
5.25%
Mortgage Type
New Conventional
Estimated Equity
$125,600
Purchase Details
Closed on
Apr 30, 2010
Sold by
Gennarelli Clifford M
Bought by
Oneill Brian P
Home Financials for this Owner
Home Financials are based on the most recent Mortgage that was taken out on this home.
Original Mortgage
$180,000
Interest Rate
5.23%
Mortgage Type
Seller Take Back
Create a Home Valuation Report for This Property
The Home Valuation Report is an in-depth analysis detailing your home's value as well as a comparison with similar homes in the area
Home Values in the Area
Average Home Value in this Area
Purchase History
| Date | Buyer | Sale Price | Title Company |
|---|---|---|---|
| Sampson Devon | $290,000 | None Listed On Document | |
| Oneill Brian P | $180,000 | Chicago Title Insurance Co |
Source: Public Records
Mortgage History
| Date | Status | Borrower | Loan Amount |
|---|---|---|---|
| Open | Sampson Devon | $261,000 | |
| Previous Owner | Oneill Brian P | $180,000 |
Source: Public Records
Tax History
| Year | Tax Paid | Tax Assessment Tax Assessment Total Assessment is a certain percentage of the fair market value that is determined by local assessors to be the total taxable value of land and additions on the property. | Land | Improvement |
|---|---|---|---|---|
| 2025 | $6,846 | $260,100 | $105,000 | $155,100 |
| 2024 | $6,700 | $260,100 | $105,000 | $155,100 |
| 2022 | $6,194 | $160,300 | $65,000 | $95,300 |
| 2021 | $6,162 | $160,300 | $65,000 | $95,300 |
| 2020 | $5,902 | $160,300 | $65,000 | $95,300 |
| 2019 | $5,784 | $160,300 | $65,000 | $95,300 |
| 2018 | $5,628 | $160,300 | $65,000 | $95,300 |
| 2017 | $5,567 | $160,300 | $65,000 | $95,300 |
| 2016 | $5,402 | $160,300 | $65,000 | $95,300 |
| 2015 | $5,316 | $160,300 | $65,000 | $95,300 |
| 2014 | $5,248 | $160,300 | $65,000 | $95,300 |
Source: Public Records
Map
Nearby Homes
- 479 Centre St
- 145 Harrison St
- 22 Church St
- 71 Spring St
- 288 Harrison St
- 104 Prospect St
- 149 Crestwood Ave
- 19 Entwistle Ave
- 36 Harrison St
- 61 Passaic Ave
- 53 Passaic Ave
- 20 Harrison St
- 108-110 Passaic Ave Unit 21
- 24 Carolyn Rd
- 78 Jannarone St Unit B
- 511 Franklin Ave Unit C6
- 50 Beech St
- 21 Moore Place Unit 1
- 83 Whitford Ave
- 114 Conover Ave
- 12 Race St Unit 1
- 12 Race St
- 10 Race St Unit 2
- 10 Race St Unit 1
- 10 Race St
- 16 Race St
- 29 Woodland Ave
- 25 Woodland Ave
- 31 Woodland Ave
- 35 Woodland Ave
- 18 Race St
- 11 Race St
- 39 Woodland Ave
- 17 Woodland Ave
- 15 Race St
- 421 Centre St Unit 2
- 421 Centre St Unit 1
- 421 Centre St
- 429 Centre St
- 429 Centre St Unit 3
Your Personal Tour Guide
Ask me questions while you tour the home.