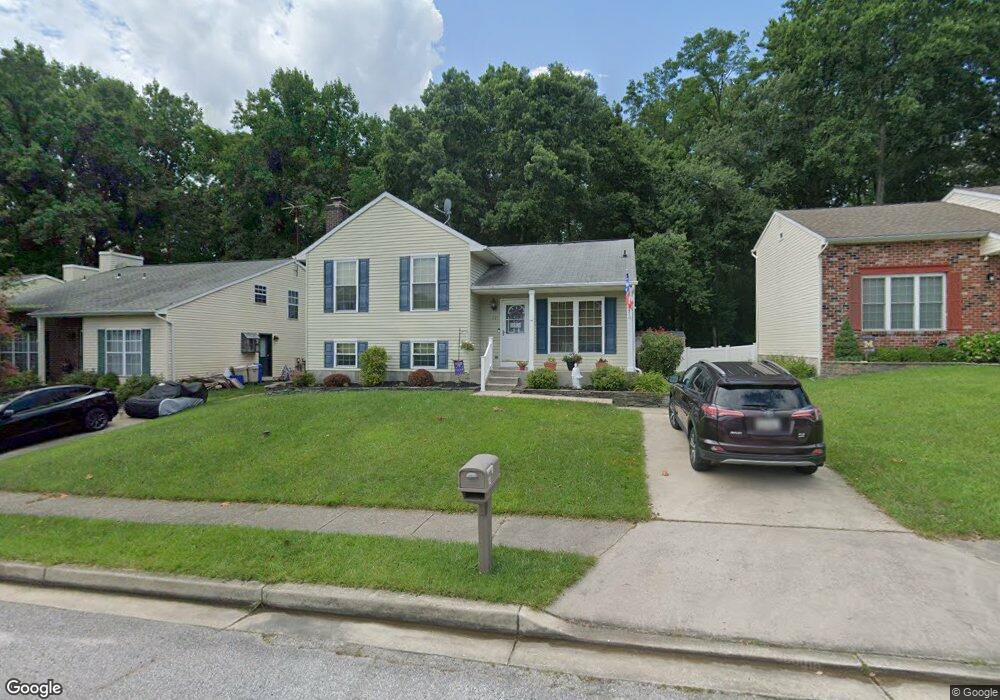
12 Shawn Ct Nottingham, MD 21236
Estimated Value: $414,121 - $465,000
About This Home
This home is located at 12 Shawn Ct, Nottingham, MD 21236 and is currently estimated at $443,530, approximately $228 per square foot. 12 Shawn Ct is a home located in Baltimore County with nearby schools including Honeygo Elementary School, Perry Hall Middle School, and Perry Hall High School.
Ownership History
We collect this data history from publicly available records. To have your information removed, we recommend requesting removal directly through your county’s website.
Purchase Details
Home Financials for this Owner
Home Financials are based on the most recent Mortgage that was taken out on this home.Purchase Details
Home Financials for this Owner
Home Financials are based on the most recent Mortgage that was taken out on this home.Purchase Details
Home Values in the Area
Average Home Value in this Area
Purchase History
We collect this data history from publicly available records. To have your information removed, we recommend requesting removal directly through your county’s website.
| Date | Buyer | Sale Price | Title Company |
|---|---|---|---|
| $320,000 | -- | ||
| $320,000 | -- | ||
| $95,000 | -- |
Mortgage History
We collect this data history from publicly available records. To have your information removed, we recommend requesting removal directly through your county’s website.
| Date | Status | Borrower | Loan Amount |
|---|---|---|---|
| Open | $210,000 | ||
| Closed | $210,000 |
Tax History
We collect this data history from publicly available records. To have your information removed, we recommend requesting removal directly through your county’s website.
| Year | Tax Paid | Tax Assessment Tax Assessment Total Assessment is a certain percentage of the fair market value that is determined by local assessors to be the total taxable value of land and additions on the property. | Land | Improvement |
|---|---|---|---|---|
| 2025 | $4,480 | $326,767 | -- | -- |
| 2024 | $4,480 | $314,133 | $0 | $0 |
| 2023 | $2,150 | $301,500 | $88,600 | $212,900 |
| 2022 | $4,221 | $294,667 | $0 | $0 |
| 2021 | $4,022 | $287,833 | $0 | $0 |
| 2020 | $4,022 | $281,000 | $88,600 | $192,400 |
| 2019 | $3,889 | $270,900 | $0 | $0 |
| 2018 | $3,913 | $260,800 | $0 | $0 |
| 2017 | $4,164 | $250,700 | $0 | $0 |
| 2016 | $3,807 | $248,833 | $0 | $0 |
| 2015 | $3,807 | $246,967 | $0 | $0 |
| 2014 | $3,807 | $245,100 | $0 | $0 |
Map
- 9003 Gardenia Rd
- 4402 Fieldgreen Rd
- 4709 Ballygar Rd
- 9005 Tammy Rd
- 9207 Gardenia Rd
- 8930 Parlo Rd
- 9204 Snyder Ln
- 11 Offspring Ct
- 9212 Snyder Ln
- 9301 Gardenia Rd
- 8907 Yvonne Ave
- 4831 Grandiflora Cir
- 4835 Grandiflora Cir
- 8735 Silver Hall Rd
- 4829 Grandiflora Cir
- 4837 Grandiflora Cir
- 3907 Hannon Ct Unit 1F
- 3907 Hannon Ct Unit 2A
- 4823 Grandiflora Cir
- 4841 Grandiflora Cir
Ask me questions while you tour the home.