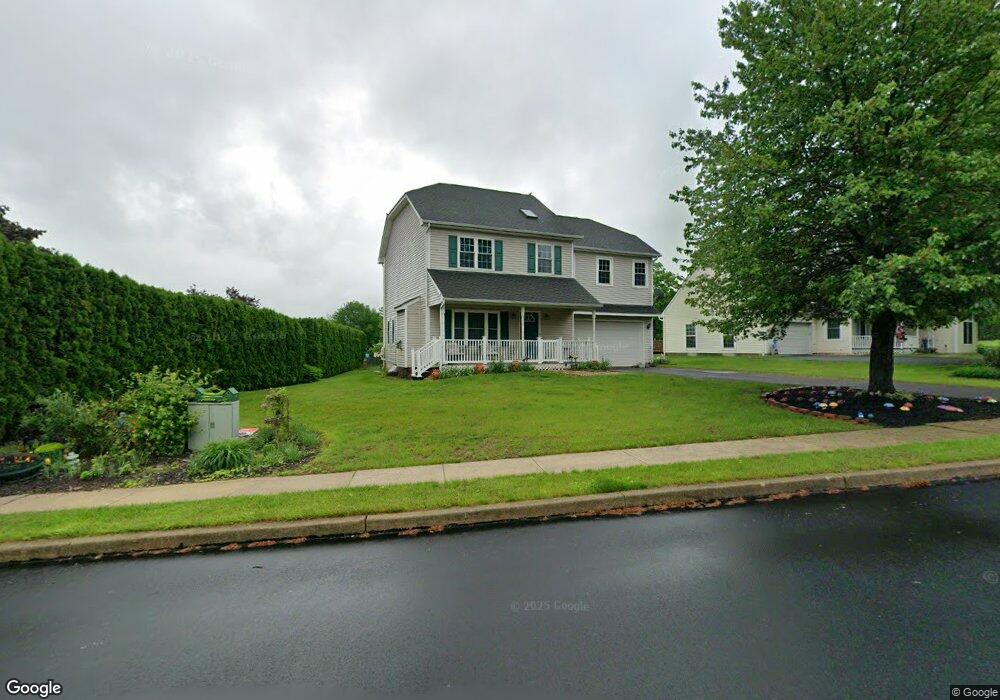
12 Stacy Dr Barto, PA 19504
Washington Township Berks NeighborhoodEstimated Value: $365,489 - $482,000
3
Beds
2
Baths
1,848
Sq Ft
$231/Sq Ft
Est. Value
About This Home
This home is located at 12 Stacy Dr, Barto, PA 19504 and is currently estimated at $426,622, approximately $230 per square foot. 12 Stacy Dr is a home located in Berks County with nearby schools including Boyertown Area Senior High School, Saint Francis Classical Catholic Academy, and St. Francis Academy.
Ownership History
Date
Name
Owned For
Owner Type
Purchase Details
Closed on
Apr 22, 2002
Sold by
Bryant Paul L and Schoenly Terri
Bought by
Schoenly Terri
Current Estimated Value
Home Financials for this Owner
Home Financials are based on the most recent Mortgage that was taken out on this home.
Original Mortgage
$18,765
Interest Rate
7.15%
Purchase Details
Closed on
Apr 17, 2001
Sold by
Bryant Paul L
Bought by
Bryant Paul L and Schoenly Terri
Create a Home Valuation Report for This Property
The Home Valuation Report is an in-depth analysis detailing your home's value as well as a comparison with similar homes in the area
Home Values in the Area
Average Home Value in this Area
Purchase History
| Date | Buyer | Sale Price | Title Company |
|---|---|---|---|
| Schoenly Terri | $71,000 | -- | |
| Bryant Paul L | -- | -- |
Source: Public Records
Mortgage History
| Date | Status | Borrower | Loan Amount |
|---|---|---|---|
| Closed | Schoenly Terri | $18,765 |
Source: Public Records
Tax History
| Year | Tax Paid | Tax Assessment Tax Assessment Total Assessment is a certain percentage of the fair market value that is determined by local assessors to be the total taxable value of land and additions on the property. | Land | Improvement |
|---|---|---|---|---|
| 2025 | $1,613 | $139,600 | $41,800 | $97,800 |
| 2024 | $5,809 | $139,600 | $41,800 | $97,800 |
| 2023 | $5,989 | $139,600 | $41,800 | $97,800 |
| 2022 | $5,501 | $139,600 | $41,800 | $97,800 |
| 2021 | $5,383 | $139,600 | $41,800 | $97,800 |
| 2020 | $5,261 | $139,600 | $41,800 | $97,800 |
| 2019 | $5,127 | $139,600 | $41,800 | $97,800 |
| 2018 | $4,939 | $139,600 | $41,800 | $97,800 |
| 2017 | $4,794 | $139,600 | $41,800 | $97,800 |
| 2016 | $1,390 | $139,600 | $41,800 | $97,800 |
| 2015 | $1,390 | $139,600 | $41,800 | $97,800 |
| 2014 | $1,390 | $139,600 | $41,800 | $97,800 |
Source: Public Records
Map
Nearby Homes
- 130 S 5th St
- 424 Niantic Rd
- 25 Berks Mont Ln
- 48 Christi Dr
- 76 Gehringer Rd
- 64 Sugar Maple Rd
- 169 Henry Rd
- 31 Sandpiper Dr
- 5 Sandpiper Dr
- 16 Cormorant Dr
- 113 Eagles Watch Dr S
- 115 Eagles Watch Dr S
- 180 Eagles Watch Dr S
- 154 Niantic Rd
- 17 Wilt Rd
- 141 Papermill Rd
- 1092 Palm Hill Rd
- 1548 County Line Rd
- 113 Nickel Dr
- 172 Stone Rd
Your Personal Tour Guide
Ask me questions while you tour the home.