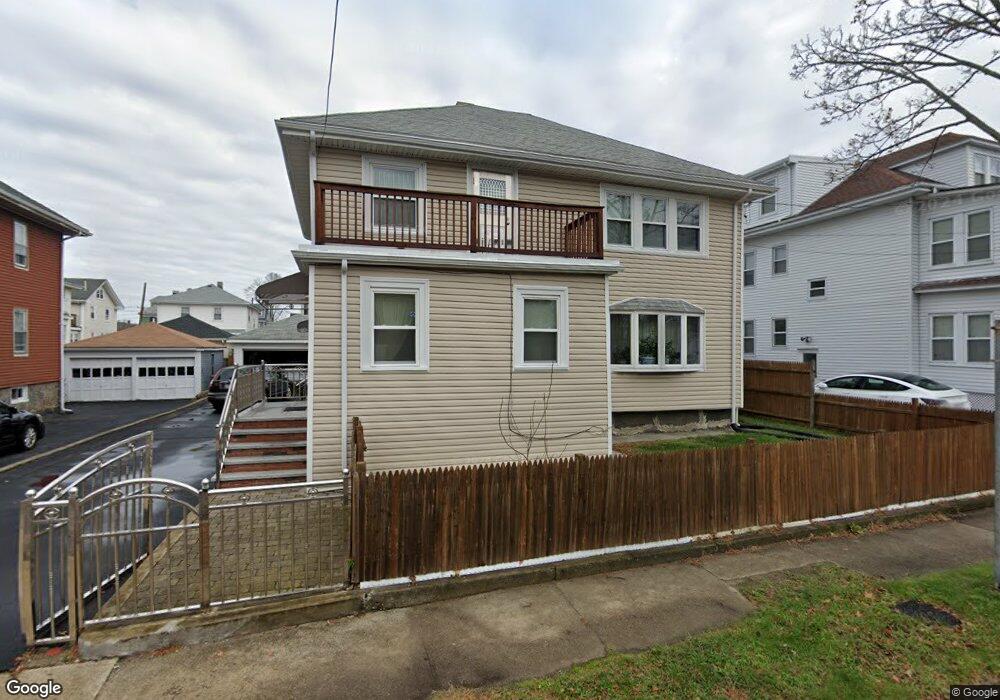
12 Vane St Quincy, MA 02171
North Quincy NeighborhoodEstimated Value: $723,000 - $893,000
4
Beds
1
Bath
1,962
Sq Ft
$420/Sq Ft
Est. Value
About This Home
This home is located at 12 Vane St, Quincy, MA 02171 and is currently estimated at $824,362, approximately $420 per square foot. 12 Vane St is a home located in Norfolk County with nearby schools including Francis W. Parker Elementary School, Atlantic Middle School, and North Quincy High School.
Ownership History
Date
Name
Owned For
Owner Type
Purchase Details
Closed on
Nov 16, 2021
Sold by
Chen Qimei
Bought by
Chen Qiping
Current Estimated Value
Purchase Details
Closed on
May 13, 2014
Sold by
Kwong Yuk K and Chen Qimei
Bought by
Chen Qimei
Purchase Details
Closed on
Dec 16, 2013
Sold by
Kwong Yuk K and Chen Qimei
Bought by
Chen Qimei
Purchase Details
Closed on
Oct 1, 2012
Sold by
Au Thomas L and Au Lap C
Bought by
Kwong Yuk K and Chen Qimei
Create a Home Valuation Report for This Property
The Home Valuation Report is an in-depth analysis detailing your home's value as well as a comparison with similar homes in the area
Home Values in the Area
Average Home Value in this Area
Purchase History
| Date | Buyer | Sale Price | Title Company |
|---|---|---|---|
| Chen Qiping | -- | None Available | |
| Chen Qimei | $112,500 | -- | |
| Chen Qimei | -- | -- | |
| Kwong Yuk K | $225,000 | -- |
Source: Public Records
Tax History
| Year | Tax Paid | Tax Assessment Tax Assessment Total Assessment is a certain percentage of the fair market value that is determined by local assessors to be the total taxable value of land and additions on the property. | Land | Improvement |
|---|---|---|---|---|
| 2025 | $9,280 | $804,900 | $396,200 | $408,700 |
| 2024 | $8,988 | $797,500 | $396,200 | $401,300 |
| 2023 | $8,175 | $734,500 | $360,100 | $374,400 |
| 2022 | $7,727 | $645,000 | $288,100 | $356,900 |
| 2021 | $7,042 | $580,100 | $288,100 | $292,000 |
| 2020 | $6,848 | $550,900 | $282,500 | $268,400 |
| 2019 | $6,623 | $527,700 | $271,600 | $256,100 |
| 2018 | $6,605 | $495,100 | $258,700 | $236,400 |
| 2017 | $6,192 | $437,000 | $235,100 | $201,900 |
| 2016 | $5,770 | $401,800 | $213,800 | $188,000 |
| 2015 | $5,352 | $366,600 | $194,300 | $172,300 |
| 2014 | $5,246 | $353,000 | $194,300 | $158,700 |
Source: Public Records
Map
Nearby Homes
- 17 Holmes St Unit 2
- 20 Ellington Rd
- 4 Edwin St
- 85 E Squantum St Unit 10
- 54 Safford St
- 98 Safford St
- 135 E Squantum St
- 115 W Squantum St Unit 816
- 115 W Squantum St Unit 607
- 115 W Squantum St Unit 517
- 115 W Squantum St Unit 203
- 11 Gould St
- 27 Herbert Rd
- 153 Vassall St
- 267-269 Farrington St
- 25 Webster St
- 113 Elm Ave
- 201 Billings St
- 19 Bass St
- 151 Hancock St Unit 7
Your Personal Tour Guide
Ask me questions while you tour the home.