12 W Elm St Darien, CT 06820
Estimated Value: $1,667,000 - $3,034,000
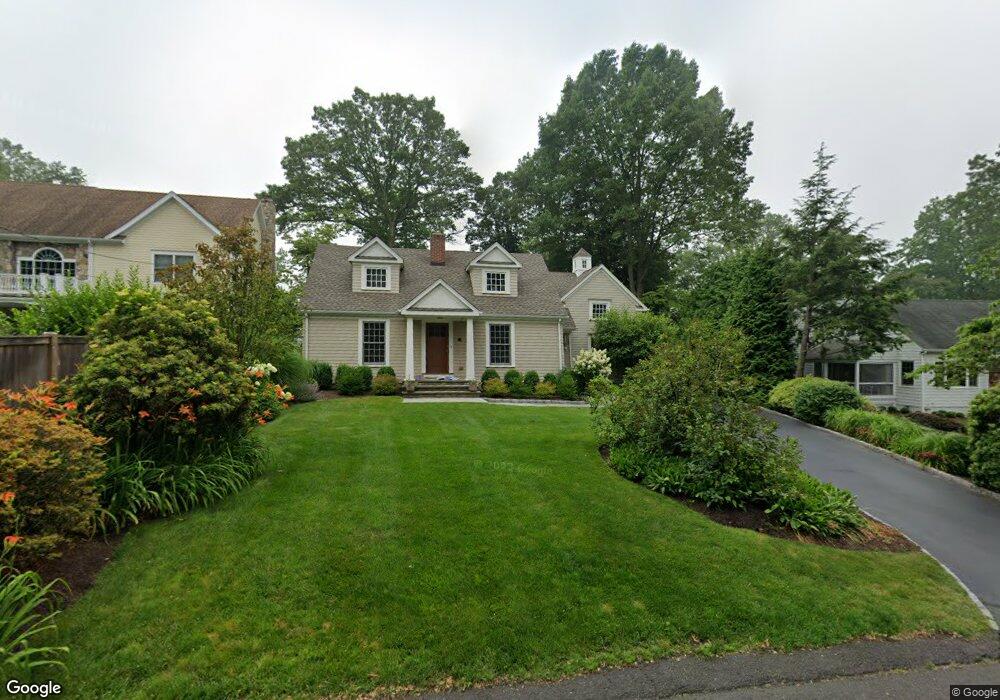
About This Home
This home is located at 12 W Elm St, Darien, CT 06820 and is currently estimated at $2,570,316, approximately $687 per square foot. 12 W Elm St is a home located in Fairfield County with nearby schools including Royle Elementary School, Middlesex Middle School, and Darien High School.
Ownership History
We collect this data history from publicly available records. To have your information removed, we recommend requesting removal directly through your county’s website.
Purchase Details
Purchase Details
Purchase Details
Home Values in the Area
Average Home Value in this Area
Purchase History
We collect this data history from publicly available records. To have your information removed, we recommend requesting removal directly through your county’s website.
| Date | Buyer | Sale Price | Title Company |
|---|---|---|---|
| $869,000 | -- | ||
| $290,000 | -- | ||
| $310,000 | -- |
Mortgage History
We collect this data history from publicly available records. To have your information removed, we recommend requesting removal directly through your county’s website.
| Date | Status | Borrower | Loan Amount |
|---|---|---|---|
| Open | $956,700 | ||
| Closed | $1,038,300 |
Tax History
We collect this data history from publicly available records. To have your information removed, we recommend requesting removal directly through your county’s website.
| Year | Tax Paid | Tax Assessment Tax Assessment Total Assessment is a certain percentage of the fair market value that is determined by local assessors to be the total taxable value of land and additions on the property. | Land | Improvement |
|---|---|---|---|---|
| 2025 | $20,843 | $1,346,450 | $572,250 | $774,200 |
| 2024 | $19,779 | $1,346,450 | $572,250 | $774,200 |
| 2023 | $17,384 | $987,140 | $440,230 | $546,910 |
| 2022 | $17,008 | $987,140 | $440,230 | $546,910 |
| 2021 | $16,623 | $987,140 | $440,230 | $546,910 |
| 2020 | $16,150 | $987,140 | $440,230 | $546,910 |
| 2019 | $16,258 | $987,140 | $440,230 | $546,910 |
| 2018 | $15,145 | $941,850 | $388,780 | $553,070 |
| 2017 | $15,220 | $941,850 | $388,780 | $553,070 |
| 2016 | $14,810 | $939,120 | $386,050 | $553,070 |
| 2015 | $14,415 | $939,120 | $386,050 | $553,070 |
| 2014 | $14,096 | $939,120 | $386,050 | $553,070 |
Map
- 11 W Elm St
- 15 W Elm St
- 9 W Elm St
- 17 W Elm St
- 9 Edgerton Ct
- 7 Edgerton Ct
- 239 Noroton Ave
- 237 Noroton Ave
- 241 Noroton Ave
- 19 W Elm St
- 37 Edgerton St
- 14 W Elm St
- 243 Noroton Ave
- 243 Noroton Ave Unit 1&2
- 243 Noroton Ave Unit 2
- 243 Noroton Ave Unit 1
- 243 Noroton Ave Unit A
- 16 W Elm St
- 11 Edgerton Ct
- 231 Noroton Ave
Ask me questions while you tour the home.