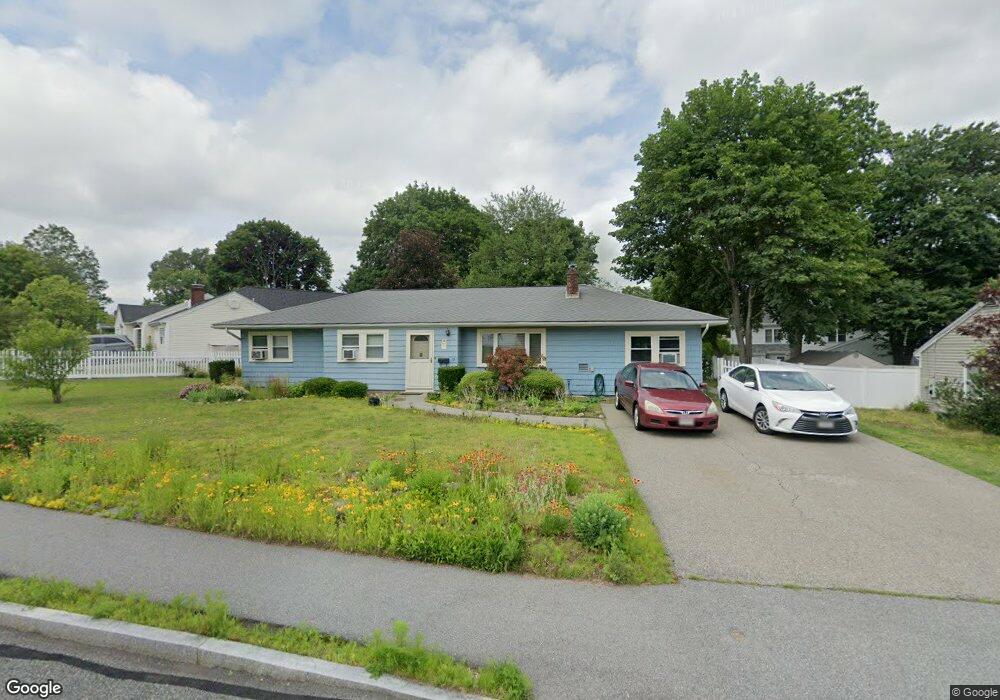
12 Waring Rd Natick, MA 01760
Estimated Value: $720,000 - $914,199
3
Beds
1
Bath
1,402
Sq Ft
$568/Sq Ft
Est. Value
About This Home
This home is located at 12 Waring Rd, Natick, MA 01760 and is currently estimated at $796,300, approximately $567 per square foot. 12 Waring Rd is a home located in Middlesex County with nearby schools including Natick High School, Bennett-Hemenway (Ben-Hem) Elementary School, and Wilson Middle School.
Ownership History
Date
Name
Owned For
Owner Type
Purchase Details
Closed on
Mar 24, 2023
Sold by
Delvecchio Michael P and Delvecchio Eileen
Bought by
Delvecchio Ft
Current Estimated Value
Purchase Details
Closed on
Oct 13, 1995
Sold by
Yale Rt
Bought by
Delvecchio Michael P and Delvecchio Eileen
Home Financials for this Owner
Home Financials are based on the most recent Mortgage that was taken out on this home.
Original Mortgage
$115,200
Interest Rate
7.71%
Mortgage Type
Purchase Money Mortgage
Create a Home Valuation Report for This Property
The Home Valuation Report is an in-depth analysis detailing your home's value as well as a comparison with similar homes in the area
Home Values in the Area
Average Home Value in this Area
Purchase History
| Date | Buyer | Sale Price | Title Company |
|---|---|---|---|
| Delvecchio Ft | -- | None Available | |
| Delvecchio Michael P | $128,000 | -- |
Source: Public Records
Mortgage History
| Date | Status | Borrower | Loan Amount |
|---|---|---|---|
| Previous Owner | Delvecchio Michael P | $130,000 | |
| Previous Owner | Delvecchio Michael P | $12,480 | |
| Previous Owner | Delvecchio Michael P | $115,200 | |
| Previous Owner | Delvecchio Michael P | $80,000 |
Source: Public Records
Tax History
| Year | Tax Paid | Tax Assessment Tax Assessment Total Assessment is a certain percentage of the fair market value that is determined by local assessors to be the total taxable value of land and additions on the property. | Land | Improvement |
|---|---|---|---|---|
| 2025 | $7,303 | $610,600 | $451,000 | $159,600 |
| 2024 | $7,112 | $580,100 | $425,900 | $154,200 |
| 2023 | $6,922 | $547,600 | $400,800 | $146,800 |
| 2022 | $6,738 | $505,100 | $365,600 | $139,500 |
| 2021 | $6,492 | $477,000 | $345,600 | $131,400 |
| 2020 | $6,288 | $462,000 | $330,600 | $131,400 |
| 2019 | $5,872 | $462,000 | $330,600 | $131,400 |
| 2018 | $5,186 | $397,400 | $300,500 | $96,900 |
| 2017 | $4,869 | $360,900 | $265,700 | $95,200 |
| 2016 | $4,683 | $345,100 | $250,700 | $94,400 |
| 2015 | $4,649 | $336,400 | $250,700 | $85,700 |
Source: Public Records
Map
Nearby Homes
- 14 Drury Ln
- 50 Wethersfield Rd
- 278 N Main St
- 48 Wethersfield Rd
- 6 Cypress Rd
- 5 Bradford Rd
- 4 Richard Rd
- 6 Ash St
- 1 Richard Rd
- 29 Irving Rd
- 340 N Main St
- 25 Irving Rd
- 8 Liberty St
- 136 Commonwealth Rd
- 78 E Plain St
- 8 Arlington Cir
- 5 Loker St
- 13 Shawmut Avenue Extension
- 7 Jackson Ct Unit B
- 45 W Plain St Unit 1
Your Personal Tour Guide
Ask me questions while you tour the home.