
Seller's Agent in 2021
Kelly Weber
ReeceNichols Real Estate
(314) 458-3972
126 Total Sales
Estimated Value: $272,396 - $288,000
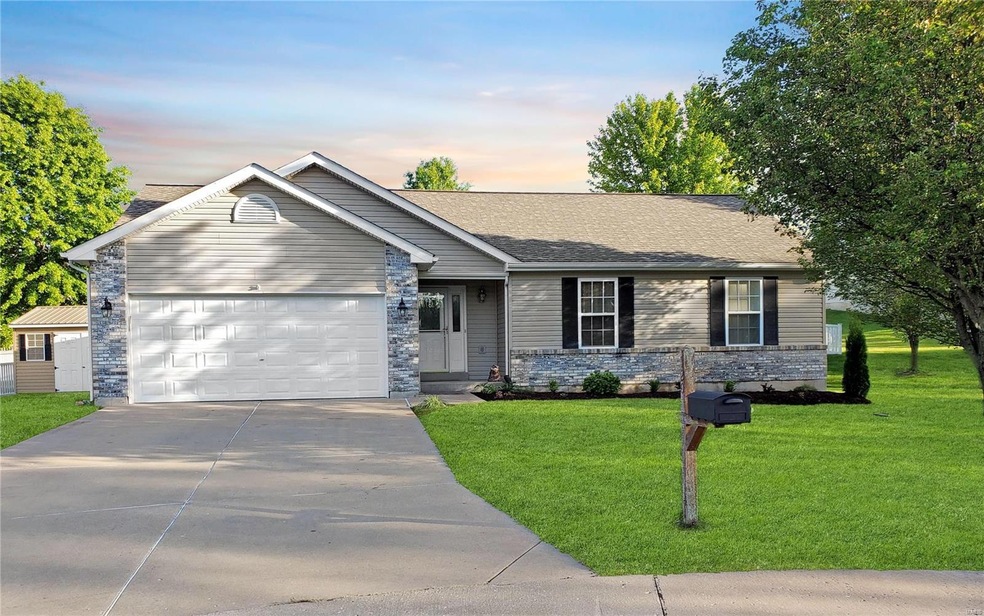
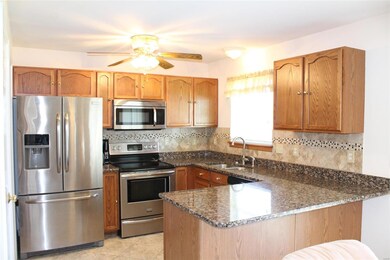
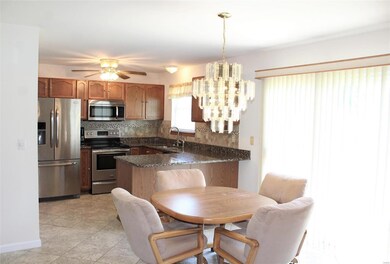
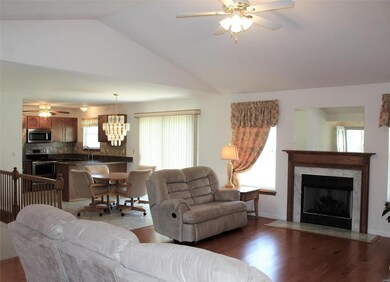
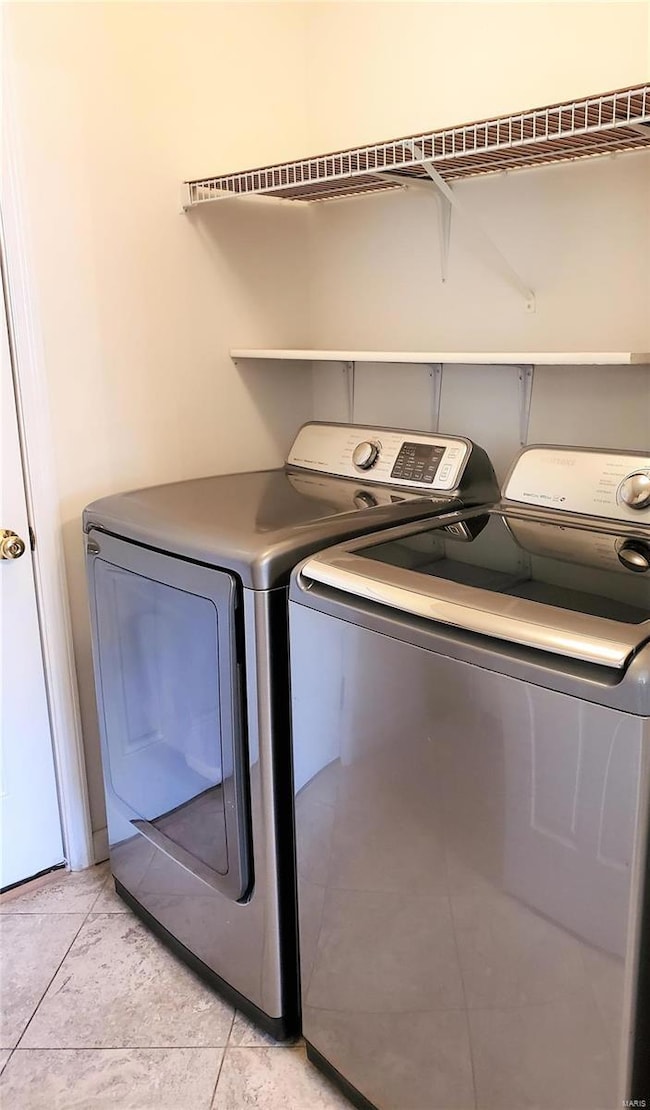
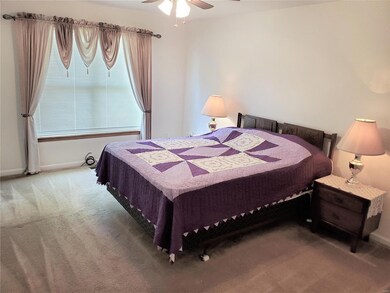
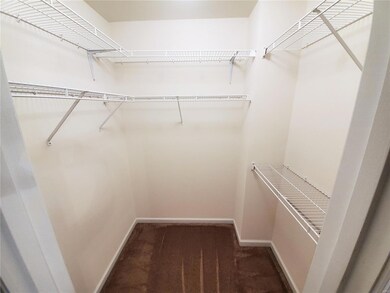
IMPECCABLY Maintained and EXCEPTIONALLY Clean! Original Owner, 3 bed - 2 bath open floor plan ranch home on quiet cul-de-sac is ready for you! Freshly painted throughout! Newer stainless steel appliances (including side by side Refrigerator AND Samsung Washer and Dryer) are included! Open, airy and bright floor plan with vaulted Great Room, gas fireplace, Granite counter tops, and more. The DRY lower level is partially finished, with a rough in, updated windows, full closet, and sump pit with new pump. The exterior will not disappoint with the stone accented front, Huge side yard, Newer storage building, back patio, cul de sac, and partially fenced flat back yard.
Last Agent to Sell the Property
ReeceNichols Real Estate License #2014009189 Listed on: 06/15/2021
Co-Listed By
Timothy Mitchell
STL Buy & Sell, LLC License #1999108277
| Date | Buyer | Sale Price | Title Company |
|---|---|---|---|
| Whitt Nancy Ann | -- | Investors Title Co |
| Date | Event | Price | List to Sale | Price per Sq Ft |
|---|---|---|---|---|
| 07/20/2021 07/20/21 | Sold | -- | -- | -- |
| 06/17/2021 06/17/21 | Pending | -- | -- | -- |
| 06/15/2021 06/15/21 | For Sale | $229,000 | -- | $175 / Sq Ft |
| Year | Tax Paid | Tax Assessment Tax Assessment Total Assessment is a certain percentage of the fair market value that is determined by local assessors to be the total taxable value of land and additions on the property. | Land | Improvement |
|---|---|---|---|---|
| 2025 | $1,953 | $31,945 | $4,997 | $26,948 |
| 2024 | $1,845 | $29,614 | $4,228 | $25,386 |
| 2023 | $1,835 | $29,613 | $4,228 | $25,386 |
| 2022 | $1,754 | $28,160 | $4,228 | $23,932 |
| 2021 | $1,776 | $149,250 | $0 | $0 |
| 2020 | $1,560 | $131,040 | $0 | $0 |
| 2019 | $1,562 | $131,040 | $0 | $0 |
| 2018 | $1,609 | $25,339 | $0 | $0 |
| 2017 | $1,613 | $25,339 | $0 | $0 |
| 2016 | $1,414 | $21,649 | $0 | $0 |
| 2015 | $1,417 | $21,649 | $0 | $0 |
| 2014 | $1,418 | $21,601 | $0 | $0 |
| 2013 | -- | $21,637 | $0 | $0 |
Seller's Agent in 2021
Kelly Weber
ReeceNichols Real Estate
(314) 458-3972
126 Total Sales
T
Seller Co-Listing Agent in 2021
Timothy Mitchell
STL Buy & Sell, LLC
L
Buyer's Agent in 2021
Lisa Garza
MORE, REALTORS
(314) 608-4467
33 Total Sales
Source: MARIS MLS
MLS Number: MIS21041598
APN: 145022000000074006
Disclaimer: Certain information contained herein is derived from information provided by parties other than Homes.com. All information provided is deemed reliable, but is not guaranteed to be accurate and should be independently verified.
![]() Based on information submitted to the MLS GRID. All data is obtained from various sources and may not have been verified by broker or MLS GRID. Supplied Open House Information is subject to change without notice. All information should be independently reviewed and verified for accuracy. Properties may or may not be listed by the office/agent presenting the information. Some IDX listings have been excluded from this website.
Based on information submitted to the MLS GRID. All data is obtained from various sources and may not have been verified by broker or MLS GRID. Supplied Open House Information is subject to change without notice. All information should be independently reviewed and verified for accuracy. Properties may or may not be listed by the office/agent presenting the information. Some IDX listings have been excluded from this website.
Based on information submitted to the MLS GRID
Ask me questions while you tour the home.