120 Pine St Duxbury, MA 02332
Estimated Value: $736,000 - $791,000
About This Home
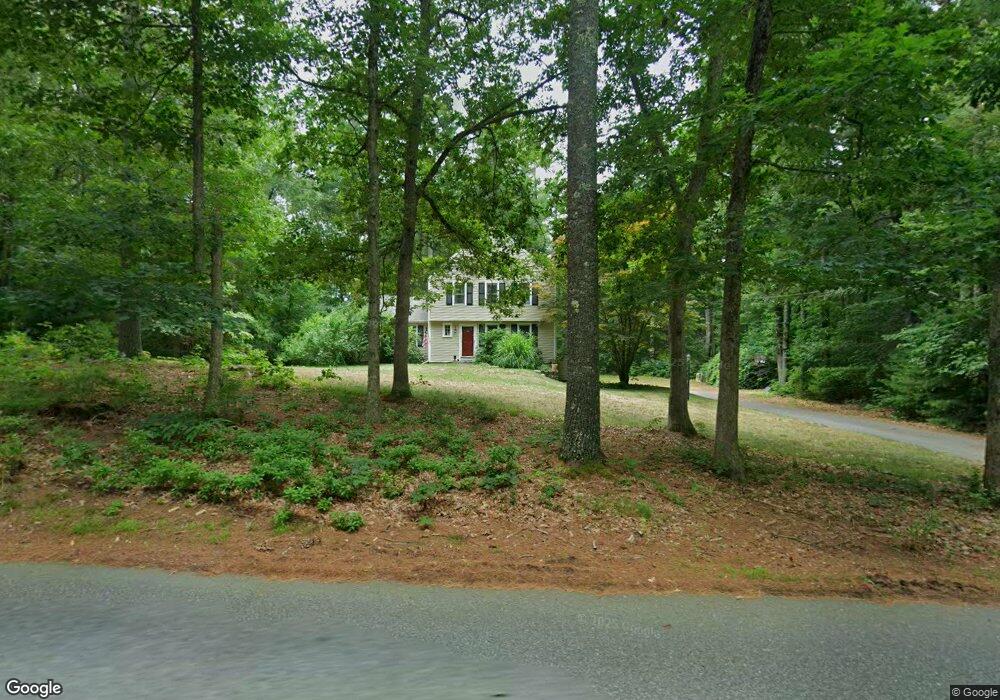
This home is located at 120 Pine St, Duxbury, MA 02332 and is currently estimated at $766,127, approximately $443 per square foot. 120 Pine St is a home located in Plymouth County with nearby schools including Chandler Elementary School, Alden School, and Duxbury Middle School.
Ownership History
We collect this data history from publicly available records. To have your information removed, we recommend requesting removal directly through your county’s website.
Purchase Details
Purchase Details
Home Values in the Area
Average Home Value in this Area
Purchase History
We collect this data history from publicly available records. To have your information removed, we recommend requesting removal directly through your county’s website.
| Date | Buyer | Sale Price | Title Company |
|---|---|---|---|
| -- | None Available | ||
| $192,000 | -- | ||
| $192,000 | -- |
Mortgage History
We collect this data history from publicly available records. To have your information removed, we recommend requesting removal directly through your county’s website.
| Date | Status | Borrower | Loan Amount |
|---|---|---|---|
| Previous Owner | $15,000 | ||
| Previous Owner | $74,000 |
Tax History
We collect this data history from publicly available records. To have your information removed, we recommend requesting removal directly through your county’s website.
| Year | Tax Paid | Tax Assessment Tax Assessment Total Assessment is a certain percentage of the fair market value that is determined by local assessors to be the total taxable value of land and additions on the property. | Land | Improvement |
|---|---|---|---|---|
| 2025 | $6,703 | $661,000 | $377,300 | $283,700 |
| 2024 | $6,607 | $656,800 | $377,300 | $279,500 |
| 2023 | $6,444 | $602,800 | $392,400 | $210,400 |
| 2022 | $6,654 | $518,200 | $323,400 | $194,800 |
| 2021 | $6,493 | $448,400 | $269,500 | $178,900 |
| 2020 | $6,698 | $456,900 | $271,700 | $185,200 |
| 2019 | $6,132 | $417,700 | $226,400 | $191,300 |
| 2018 | $6,088 | $401,600 | $210,400 | $191,200 |
| 2017 | $6,086 | $392,400 | $196,600 | $195,800 |
| 2016 | $6,102 | $392,400 | $196,600 | $195,800 |
| 2015 | $5,731 | $367,400 | $171,600 | $195,800 |
Map
- 65 Chapel St
- 61 Chapel St
- 216 Autumn Ave
- 4 Green Holly Dr
- 1 Sycamore Dr
- 117 Pelham St
- 254 Kingstown Way
- 6 Station St
- 239 Kingstown Way
- 4 Station St
- 600 Summer St Unit 17
- 7 Barbara Rd
- 13 Lydon Ln
- 46 Foxworth Ln
- 15 Village Path
- 71 Valley St
- 55 Union Bridge Rd
- 26 Brookings Dr
- 76 Woodridge Rd
- 164 Forest St
Ask me questions while you tour the home.