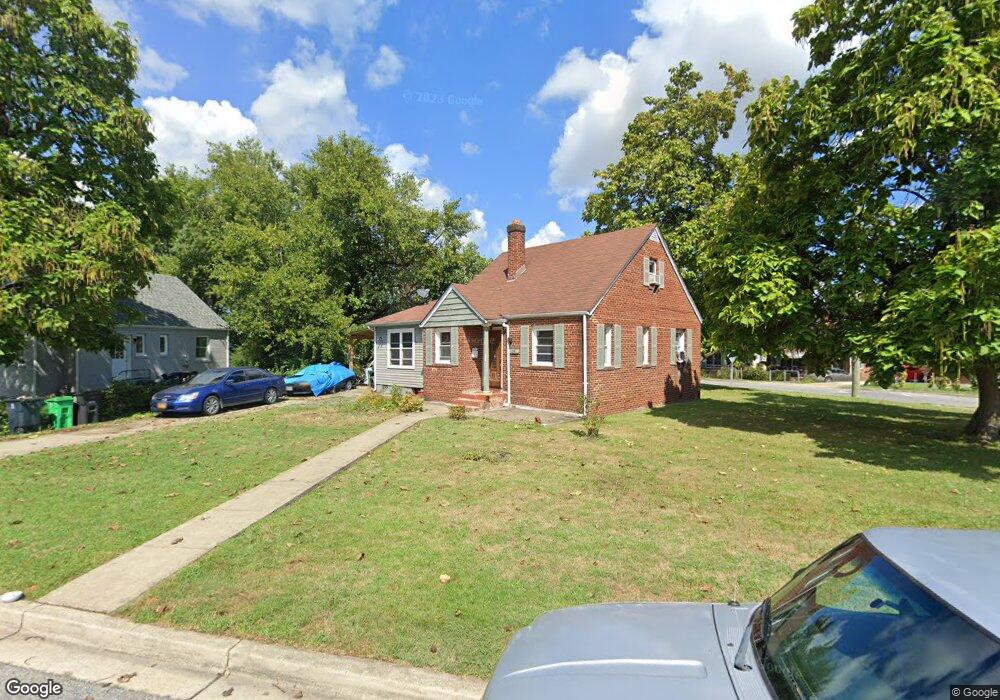
1201 Nye St Capitol Heights, MD 20743
Estimated Value: $305,000 - $364,000
Studio
1
Bath
1,412
Sq Ft
$244/Sq Ft
Est. Value
About This Home
This home is located at 1201 Nye St, Capitol Heights, MD 20743 and is currently estimated at $344,936, approximately $244 per square foot. 1201 Nye St is a home located in Prince George's County with nearby schools including Robert R. Gray Elementary School, G. James Gholson Middle School, and Fairmont Heights High School.
Ownership History
Date
Name
Owned For
Owner Type
Purchase Details
Closed on
Sep 30, 2004
Sold by
Singh Darwin
Bought by
Hernandez Juan F
Current Estimated Value
Purchase Details
Closed on
Jan 30, 2004
Sold by
Jpmorgan Chase Bank Trustee
Bought by
Singh Darwin
Purchase Details
Closed on
Mar 21, 2003
Sold by
Taylor Shango
Bought by
Jpmorgan Chase Bank Trustee and 200 Suite
Purchase Details
Closed on
Oct 17, 2001
Sold by
Ambush Sean
Bought by
Taylor Shango
Purchase Details
Closed on
Sep 17, 2001
Sold by
Furr Allethia V
Bought by
Ambush Sean
Create a Home Valuation Report for This Property
The Home Valuation Report is an in-depth analysis detailing your home's value as well as a comparison with similar homes in the area
Home Values in the Area
Average Home Value in this Area
Purchase History
We collect this data history from publicly available records. To have your information removed, we recommend requesting removal directly through your county’s website.
| Date | Buyer | Sale Price | Title Company |
|---|---|---|---|
| Hernandez Juan F | $155,000 | -- | |
| Singh Darwin | $65,000 | -- | |
| Jpmorgan Chase Bank Trustee | $94,500 | -- | |
| Taylor Shango | $107,000 | -- | |
| Ambush Sean | $35,000 | -- |
Source: Public Records
Tax History
| Year | Tax Paid | Tax Assessment Tax Assessment Total Assessment is a certain percentage of the fair market value that is determined by local assessors to be the total taxable value of land and additions on the property. | Land | Improvement |
|---|---|---|---|---|
| 2025 | $4,121 | $268,833 | -- | -- |
| 2024 | $4,121 | $250,467 | -- | -- |
| 2023 | $3,847 | $232,100 | $65,600 | $166,500 |
| 2022 | $3,594 | $215,067 | $0 | $0 |
| 2021 | $3,341 | $198,033 | $0 | $0 |
| 2020 | $3,087 | $181,000 | $45,300 | $135,700 |
| 2019 | $3,087 | $181,000 | $45,300 | $135,700 |
| 2018 | $3,087 | $181,000 | $45,300 | $135,700 |
| 2017 | $3,141 | $184,600 | $0 | $0 |
| 2016 | -- | $154,467 | $0 | $0 |
| 2015 | $2,041 | $124,333 | $0 | $0 |
| 2014 | $2,041 | $94,200 | $0 | $0 |
Source: Public Records
Map
Nearby Homes
Your Personal Tour Guide
Ask me questions while you tour the home.