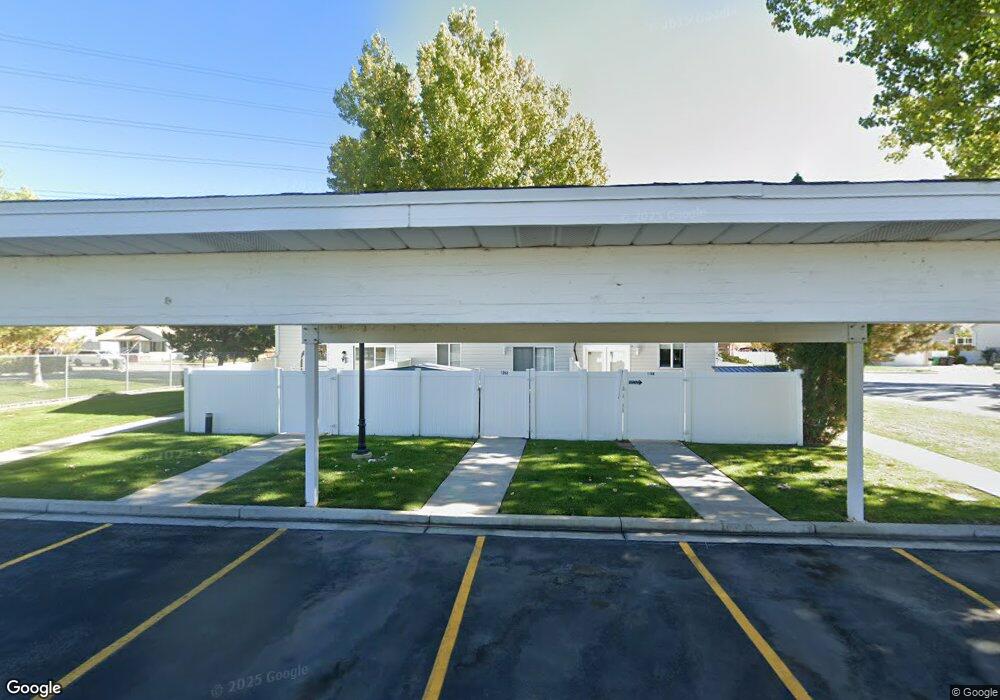
1202 N 2780 W Provo, UT 84601
Lakeview NeighborhoodEstimated Value: $340,251 - $387,000
3
Beds
2
Baths
1,311
Sq Ft
$272/Sq Ft
Est. Value
About This Home
This home is located at 1202 N 2780 W, Provo, UT 84601 and is currently estimated at $357,063, approximately $272 per square foot. 1202 N 2780 W is a home located in Utah County with nearby schools including Lakeview School, Dixon Middle School, and Provo High School.
Ownership History
Date
Name
Owned For
Owner Type
Purchase Details
Closed on
Aug 15, 1997
Sold by
Nelson Todd R and Nelson Kelly K
Bought by
Collison T Ross and Collison Lisa S
Current Estimated Value
Home Financials for this Owner
Home Financials are based on the most recent Mortgage that was taken out on this home.
Original Mortgage
$102,965
Outstanding Balance
$15,528
Interest Rate
7.61%
Mortgage Type
FHA
Estimated Equity
$341,535
Create a Home Valuation Report for This Property
The Home Valuation Report is an in-depth analysis detailing your home's value as well as a comparison with similar homes in the area
Home Values in the Area
Average Home Value in this Area
Purchase History
| Date | Buyer | Sale Price | Title Company |
|---|---|---|---|
| Collison T Ross | -- | -- |
Source: Public Records
Mortgage History
| Date | Status | Borrower | Loan Amount |
|---|---|---|---|
| Open | Collison T Ross | $102,965 |
Source: Public Records
Tax History
| Year | Tax Paid | Tax Assessment Tax Assessment Total Assessment is a certain percentage of the fair market value that is determined by local assessors to be the total taxable value of land and additions on the property. | Land | Improvement |
|---|---|---|---|---|
| 2025 | $1,824 | $177,705 | -- | -- |
| 2024 | $1,824 | $179,520 | $0 | $0 |
| 2023 | $1,800 | $174,625 | $0 | $0 |
| 2022 | $1,754 | $171,655 | $0 | $0 |
| 2021 | $1,375 | $234,700 | $35,200 | $199,500 |
| 2020 | $1,352 | $216,300 | $32,400 | $183,900 |
| 2019 | $1,274 | $212,000 | $28,000 | $184,000 |
| 2018 | $1,117 | $188,500 | $24,000 | $164,500 |
| 2017 | $972 | $90,145 | $0 | $0 |
| 2016 | $948 | $81,950 | $0 | $0 |
| 2015 | $844 | $73,700 | $0 | $0 |
| 2014 | $779 | $70,950 | $0 | $0 |
Source: Public Records
Map
Nearby Homes
Your Personal Tour Guide
Ask me questions while you tour the home.