1203 21st Ave Longview, WA 98632
Old West Side NeighborhoodEstimated Value: $459,802 - $612,000
About This Home
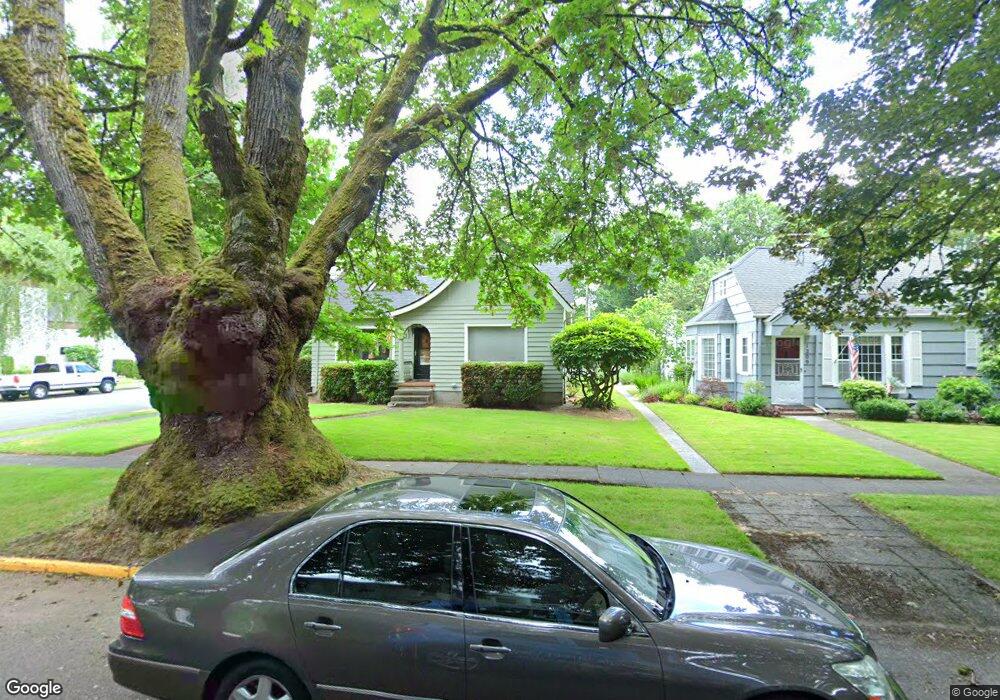
This home is located at 1203 21st Ave, Longview, WA 98632 and is currently estimated at $525,701, approximately $183 per square foot. 1203 21st Ave is a home located in Cowlitz County with nearby schools including Northlake Elementary School, Monticello Middle School, and R.A. Long High School.
Ownership History
We collect this data history from publicly available records. To have your information removed, we recommend requesting removal directly through your county’s website.
Purchase Details
Home Values in the Area
Average Home Value in this Area
Purchase History
We collect this data history from publicly available records. To have your information removed, we recommend requesting removal directly through your county’s website.
| Date | Buyer | Sale Price | Title Company |
|---|---|---|---|
| $194,000 | Cascade Title |
Tax History
We collect this data history from publicly available records. To have your information removed, we recommend requesting removal directly through your county’s website.
| Year | Tax Paid | Tax Assessment Tax Assessment Total Assessment is a certain percentage of the fair market value that is determined by local assessors to be the total taxable value of land and additions on the property. | Land | Improvement |
|---|---|---|---|---|
| 2025 | $3,927 | $424,840 | $71,400 | $353,440 |
| 2024 | $3,927 | $453,530 | $71,400 | $382,130 |
| 2023 | $3,760 | $435,490 | $71,400 | $364,090 |
| 2022 | $3,635 | $439,170 | $71,400 | $367,770 |
| 2021 | $3,540 | $365,610 | $71,400 | $294,210 |
| 2020 | $2,884 | $320,740 | $71,400 | $249,340 |
| 2019 | $2,848 | $274,114 | $71,400 | $202,714 |
| 2018 | $3,113 | $264,460 | $71,400 | $193,060 |
| 2017 | $2,795 | $237,520 | $71,380 | $166,140 |
| 2016 | $2,600 | $216,840 | $67,980 | $148,860 |
| 2015 | $2,747 | $206,180 | $67,980 | $138,200 |
| 2013 | -- | $209,320 | $66,000 | $143,320 |
Map
- 1209 21st Ave
- 1219 21st Ave
- 2101 Hemlock St
- 1202 22nd Ave
- 2030 Hemlock St Unit 4 (basement)
- 2030 Hemlock St Unit 2 (upstairs)
- 1208 22nd Ave
- 1221 21st Ave
- 1214 22nd Ave
- 1158 22nd Ave
- 1208 21st Ave
- 1149 21st Ave
- 1225 21st Ave
- 1218 22nd Ave
- 1152 22nd Ave
- 1220 21st Ave
- 1218 21st Ave
- 1224 22nd Ave
- 1148 22nd Ave
- 1229 21st Ave
Ask me questions while you tour the home.