1203 N Morrison St Appleton, WI 54911
Historic Central NeighborhoodEstimated Value: $224,000 - $245,000
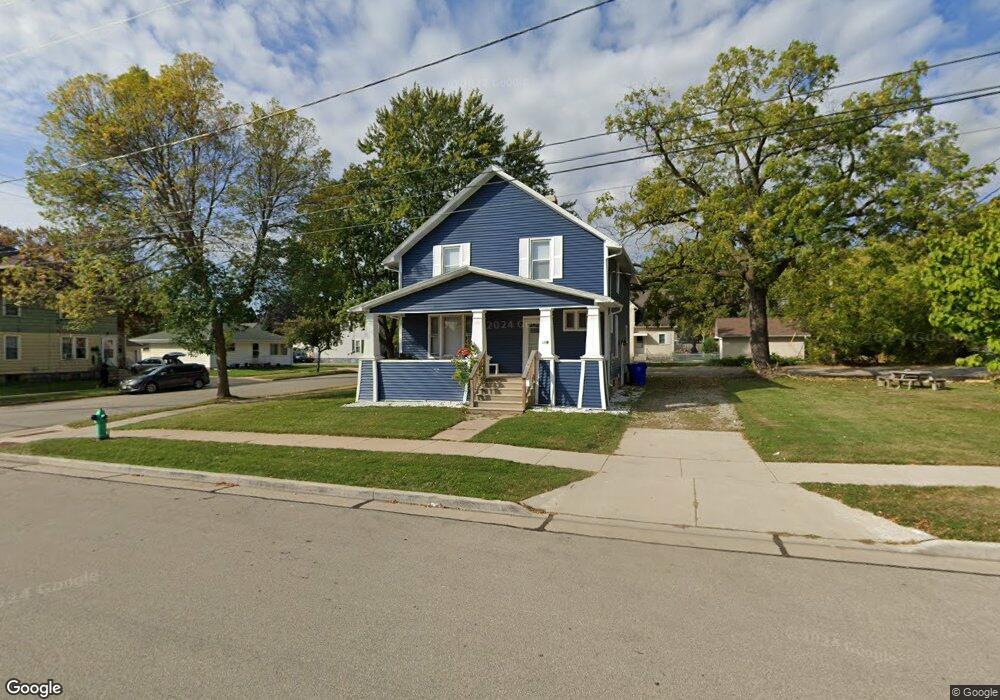
About This Home
Located in Central Appleton, our Historic Morrison Mansion is a beautifully-restored craftsman house with over 1,700 square feet of living space. The downstairs level includes a formidable dining area that opens to a large living room. The dining area has a high-end set with upholstered chairs that seats eight; and the sectional couch is large enough to seat at least 10 people with views of the grand dining area and a 65” TV. The entire house has restored hardwood floors, with some new modern luxury vinyl plank in the kitchen and one bathroom.
Three bedrooms include a king bed; a queen bed; and a triple bunk room that includes an extra long twin, extra long full and extra long queen-sized mattresses. The bunks are a little tighter, but it’s a great way for us to be able to host various family and group dynamics.
The remodel was completed in April of 2022, so everything is brand new. The two bathrooms were completely remodeled to have high-end appointments of gray and gold marble tile, shower doors, and even a first-floor laundry and double sink included in the lower-level bathroom. The upstairs bathroom also has a lovely vanity with a sitting bench for getting ready with a marble-tile backdrop.
Other highlights of this unit include stainless steel appliances with a fridge with ice maker and water; first floor laundry newly installed; quartz countertops; historic wood built-ins in the dining area, and the most amazing newly-refinished original hardwood floors. The exterior also got a complete refresh, with rebuilt porch, restored historic columns, and all new siding. We also just adore the abundant sized front porch area!
Ownership History
We collect this data history from publicly available records. To have your information removed, we recommend requesting removal directly through your county’s website.
Purchase Details
Home Financials for this Owner
Home Financials are based on the most recent Mortgage that was taken out on this home.Home Values in the Area
Average Home Value in this Area
Purchase History
We collect this data history from publicly available records. To have your information removed, we recommend requesting removal directly through your county’s website.
| Date | Buyer | Sale Price | Title Company |
|---|---|---|---|
| $25,000 | New Title Company Name |
Mortgage History
We collect this data history from publicly available records. To have your information removed, we recommend requesting removal directly through your county’s website.
| Date | Status | Borrower | Loan Amount |
|---|---|---|---|
| Open | $87,500 |
Property History
We collect this data history from publicly available records. To have your information removed, we recommend requesting removal directly through your county’s website.
| Date | Event | Price | List to Sale | Price per Sq Ft |
|---|---|---|---|---|
| 03/16/2026 03/16/26 | Off Market | $3,900 | -- | -- |
| 02/11/2026 02/11/26 | For Rent | $3,900 | 0.0% | -- |
| 01/05/2026 01/05/26 | Off Market | $3,900 | -- | -- |
| 12/03/2025 12/03/25 | For Rent | $3,900 | -- | -- |
Tax History
We collect this data history from publicly available records. To have your information removed, we recommend requesting removal directly through your county’s website.
| Year | Tax Paid | Tax Assessment Tax Assessment Total Assessment is a certain percentage of the fair market value that is determined by local assessors to be the total taxable value of land and additions on the property. | Land | Improvement |
|---|---|---|---|---|
| 2025 | $2,334 | $188,700 | $36,100 | $152,600 |
| 2024 | $2,334 | $155,400 | $36,100 | $119,300 |
| 2023 | $2,467 | $155,400 | $36,100 | $119,300 |
| 2022 | $2,396 | $112,300 | $30,400 | $81,900 |
| 2021 | $2,294 | $112,300 | $30,400 | $81,900 |
| 2020 | $2,248 | $112,300 | $30,400 | $81,900 |
| 2019 | $2,197 | $112,300 | $30,400 | $81,900 |
| 2018 | $2,331 | $104,500 | $27,400 | $77,100 |
| 2017 | $2,288 | $104,500 | $27,400 | $77,100 |
| 2016 | $2,255 | $104,500 | $27,400 | $77,100 |
| 2015 | $2,281 | $104,500 | $27,400 | $77,100 |
| 2014 | $2,656 | $104,500 | $27,400 | $77,100 |
| 2013 | $3,396 | $110,900 | $26,100 | $84,800 |
Map
- 110 E Randall St
- 809 N Durkee St
- 219 E Hancock St
- 714 N Oneida St
- 814 N Drew St
- 519 W Summer St
- 1223 N Harriman St
- 714 N Bateman St
- 715 N Harriman St
- 707 E Brewster St
- 707 E Randall St
- 1820 N Superior St
- 1011 N Fair St
- 1729 N Harriman St
- 1631 N Alvin St
- 1119 N Richmond St
- 719 N Fair St
- 808 E Hancock St
- 1711 N Meade St
- 809 E Hancock St
- 127 E Summer St
- 121 E Summer St
- 115 E Summer St
- 1202 N Oneida St
- 1108 N Oneida St
- 114 E Summer St
- 1208 N Oneida St Unit A
- 1208 N Oneida St Unit B
- 1208 N Oneida St
- 114 E Spring St
- 1120 N Oneida St
- 120 E Spring St
- 126 E Spring St
- 120 E Spring St Unit C
- 1114 N Oneida St
- 1208 1/2 N Oneida St
- 1209 N Morrison St
- 1102 N Oneida St
- 1103 N Morrison St
- 1114 N Morrison St
Ask me questions while you tour the home.