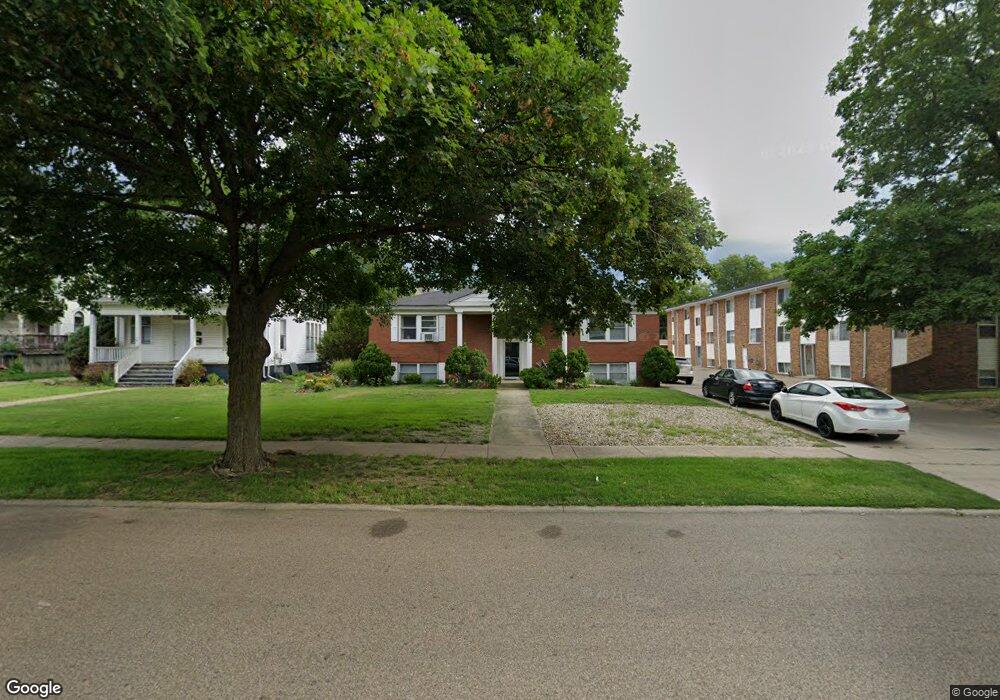
1206 E Grove St Bloomington, IL 61701
Founders Grove NeighborhoodAbout This Home
THERE ARE NO UNITS CURRENTLY AVAILABLE OR COMING AVAILABLE AT THIS PROPERTY
Ownership History
We collect this data history from publicly available records. To have your information removed, we recommend requesting removal directly through your county’s website.
Purchase Details
Purchase Details
Home Values in the Area
Average Home Value in this Area
Purchase History
We collect this data history from publicly available records. To have your information removed, we recommend requesting removal directly through your county’s website.
| Date | Buyer | Sale Price | Title Company |
|---|---|---|---|
| -- | None Listed On Document | ||
| -- | Attorney |
Mortgage History
We collect this data history from publicly available records. To have your information removed, we recommend requesting removal directly through your county’s website.
| Date | Status | Borrower | Loan Amount |
|---|---|---|---|
| Previous Owner | $217,192 | ||
| Previous Owner | $477,078 | ||
| Previous Owner | $100,000 |
Property History
We collect this data history from publicly available records. To have your information removed, we recommend requesting removal directly through your county’s website.
| Date | Event | Price | List to Sale | Price per Sq Ft |
|---|---|---|---|---|
| 11/29/2022 11/29/22 | Price Changed | $550 | -9.8% | -- |
| 10/22/2022 10/22/22 | Price Changed | $610 | +10.9% | -- |
| 10/12/2022 10/12/22 | Price Changed | $550 | -21.4% | -- |
| 10/10/2022 10/10/22 | For Rent | $700 | 0.0% | -- |
| 06/07/2022 06/07/22 | For Rent | $700 | 0.0% | -- |
| 05/18/2022 05/18/22 | For Rent | $700 | -- | -- |
Tax History
We collect this data history from publicly available records. To have your information removed, we recommend requesting removal directly through your county’s website.
| Year | Tax Paid | Tax Assessment Tax Assessment Total Assessment is a certain percentage of the fair market value that is determined by local assessors to be the total taxable value of land and additions on the property. | Land | Improvement |
|---|---|---|---|---|
| 2025 | $25,345 | $329,246 | $61,614 | $267,632 |
| 2024 | $20,041 | $312,591 | $58,497 | $254,094 |
| 2022 | $20,041 | $235,812 | $44,129 | $191,683 |
| 2021 | $18,969 | $223,207 | $41,770 | $181,437 |
| 2020 | $18,919 | $223,207 | $41,770 | $181,437 |
| 2019 | $18,864 | $223,207 | $41,770 | $181,437 |
| 2018 | $18,417 | $218,830 | $40,951 | $177,879 |
| 2017 | $18,423 | $218,830 | $40,951 | $177,879 |
| 2016 | $18,391 | $218,830 | $40,951 | $177,879 |
| 2015 | $17,640 | $210,493 | $39,391 | $171,102 |
| 2014 | $17,080 | $210,493 | $39,391 | $171,102 |
| 2013 | -- | $210,493 | $39,391 | $171,102 |
Map
- 1111 E Jefferson St Unit 9
- 1106 E Jefferson St Unit 6
- 1117 E Olive St
- 304 Perrin Ave
- 1202 Elmwood Rd
- 405 Kreitzer Ave
- 1605 E Taylor St
- 16 Woodruff Dr
- 813 E Jefferson St
- 618 Maple St
- 104 Fairview Ave
- 4 Woodruff Dr
- 517 Vale St
- 513 Maizefield Ave
- 1 Ryan Dr
- 27 Country Club Place
- 510 E Mulberry St Unit 1
- 511 E Jackson St
- 1109 N State St
- 307 S Mclean St
- 104 S State St
- 101 S State St
- 102 N State St
- 103 S State St
- 105 S State St
- 1202 E Grove St
- 1204 E Grove St
- 1037 E Front St
- 1122 E Grove St
- 1035 E Front St
- 1120 E Grove St
- 1213 E Washington St
- 1033 E Front St
- 1204 E Washington St
- 1215 E Washington St
- 1201 E Grove St
- 1116 E Grove St
- 1028 E Front St
- 1203 E Grove St
- 1206 E Washington St
Ask me questions while you tour the home.