Estimated Value: $116,000 - $155,000
3
Beds
2
Baths
1,416
Sq Ft
$95/Sq Ft
Est. Value
About This Home
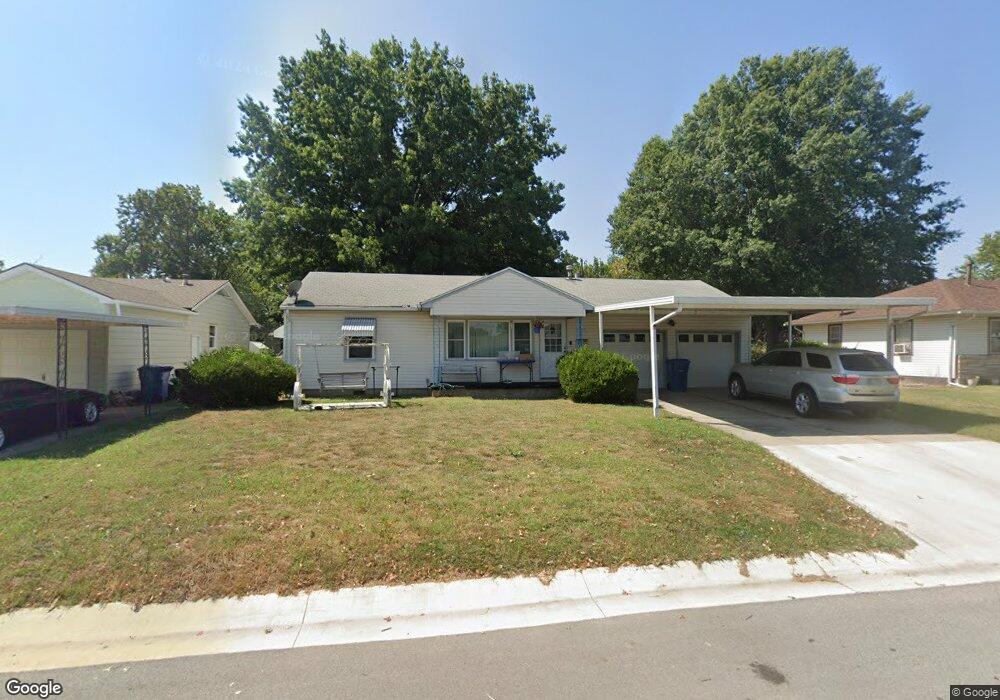
This home is located at 1209 C St NE, Miami, OK 74354 and is currently estimated at $135,135, approximately $95 per square foot. 1209 C St NE is a home located in Ottawa County with nearby schools including Miami High School and Mt. Olive Lutheran School.
Ownership History
Date
Name
Owned For
Owner Type
Purchase Details
Closed on
May 6, 2020
Sold by
Shafer Bobby R and Shafer Dixie Dixie
Bought by
Gary Graham and Gary Cassandra Graham
Current Estimated Value
Home Financials for this Owner
Home Financials are based on the most recent Mortgage that was taken out on this home.
Original Mortgage
$85,656
Outstanding Balance
$76,024
Interest Rate
3.5%
Mortgage Type
New Conventional
Estimated Equity
$59,111
Purchase Details
Closed on
Jul 11, 1997
Bought by
Chmila Ina Mae
Purchase Details
Closed on
Jul 1, 1992
Bought by
Linda George and Linda Childers
Create a Home Valuation Report for This Property
The Home Valuation Report is an in-depth analysis detailing your home's value as well as a comparison with similar homes in the area
Purchase History
| Date | Buyer | Sale Price | Title Company |
|---|---|---|---|
| Gary Graham | $85,000 | Apex Title Northeast Ok Llc | |
| Chmila Ina Mae | $54,000 | -- | |
| Linda George | $42,000 | -- |
Source: Public Records
Mortgage History
| Date | Status | Borrower | Loan Amount |
|---|---|---|---|
| Open | Gary Graham | $85,656 |
Source: Public Records
Tax History
| Year | Tax Paid | Tax Assessment Tax Assessment Total Assessment is a certain percentage of the fair market value that is determined by local assessors to be the total taxable value of land and additions on the property. | Land | Improvement |
|---|---|---|---|---|
| 2025 | $894 | $10,281 | $635 | $9,646 |
| 2024 | $866 | $9,981 | $576 | $9,405 |
| 2023 | $866 | $9,690 | $546 | $9,144 |
| 2022 | $803 | $9,690 | $546 | $9,144 |
| 2021 | $821 | $9,690 | $546 | $9,144 |
| 2020 | $437 | $6,583 | $503 | $6,080 |
| 2019 | $376 | $6,583 | $395 | $6,188 |
| 2018 | $379 | $6,583 | $395 | $6,188 |
| 2017 | $385 | $6,583 | $395 | $6,188 |
| 2016 | $368 | $6,583 | $570 | $6,013 |
| 2015 | $531 | $5,971 | $768 | $5,203 |
| 2014 | $375 | $6,583 | $570 | $6,013 |
Source: Public Records
Map
Nearby Homes
Your Personal Tour Guide
Ask me questions while you tour the home.