121 Pilgrim Rd Marshfield, MA 02050
Estimated Value: $1,496,000 - $2,371,000
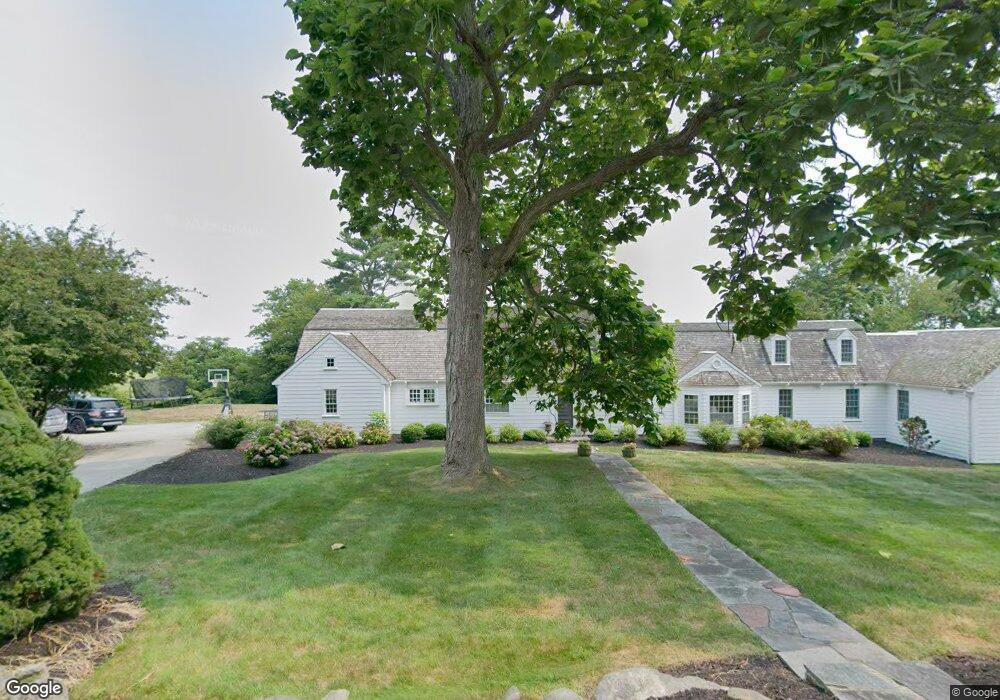
About This Home
This home is located at 121 Pilgrim Rd, Marshfield, MA 02050 and is currently estimated at $1,986,077, approximately $663 per square foot. 121 Pilgrim Rd is a home located in Plymouth County with nearby schools including South River, Furnace Brook Middle School, and Marshfield High School.
Ownership History
We collect this data history from publicly available records. To have your information removed, we recommend requesting removal directly through your county’s website.
Purchase Details
Home Financials for this Owner
Home Financials are based on the most recent Mortgage that was taken out on this home.Home Values in the Area
Average Home Value in this Area
Purchase History
We collect this data history from publicly available records. To have your information removed, we recommend requesting removal directly through your county’s website.
| Date | Buyer | Sale Price | Title Company |
|---|---|---|---|
| $853,000 | -- |
Mortgage History
We collect this data history from publicly available records. To have your information removed, we recommend requesting removal directly through your county’s website.
| Date | Status | Borrower | Loan Amount |
|---|---|---|---|
| Open | $417,000 | ||
| Closed | $300,000 | ||
| Closed | $400,000 | ||
| Closed | $253,000 |
Tax History
We collect this data history from publicly available records. To have your information removed, we recommend requesting removal directly through your county’s website.
| Year | Tax Paid | Tax Assessment Tax Assessment Total Assessment is a certain percentage of the fair market value that is determined by local assessors to be the total taxable value of land and additions on the property. | Land | Improvement |
|---|---|---|---|---|
| 2025 | $17,860 | $1,804,000 | $746,100 | $1,057,900 |
| 2024 | $17,411 | $1,675,700 | $746,100 | $929,600 |
| 2023 | $16,421 | $1,475,800 | $664,800 | $811,000 |
| 2022 | $16,421 | $1,268,000 | $572,700 | $695,300 |
| 2021 | $15,725 | $1,192,200 | $572,700 | $619,500 |
| 2020 | $15,892 | $1,192,200 | $572,700 | $619,500 |
| 2019 | $14,824 | $1,107,900 | $529,200 | $578,700 |
| 2018 | $13,839 | $1,035,100 | $485,600 | $549,500 |
| 2017 | $12,230 | $891,400 | $395,300 | $496,100 |
| 2016 | $11,806 | $850,600 | $377,800 | $472,800 |
| 2015 | $10,312 | $775,900 | $377,800 | $398,100 |
| 2014 | $10,402 | $782,700 | $377,800 | $404,900 |
Map
- 30 Tupelo Rd
- 8 Duxbury St
- 12 Julian St
- 4 Schooner Way Unit 4
- 6 Shipyard Rd
- 170 Meadowview St
- 1146 Ferry St
- 11 Boles Rd
- 61 Grove St
- 332 Grove St
- 134 Wellington Ave
- 1 Carpenter Ln
- 65 Ireland Rd
- 0 Central Ave
- 33 Central Ave Unit 11
- 33 Central Ave Unit 9
- 297 Elm St
- 91 Winslow St
- 120 Monitor Rd
- 107 Towne Way
Ask me questions while you tour the home.