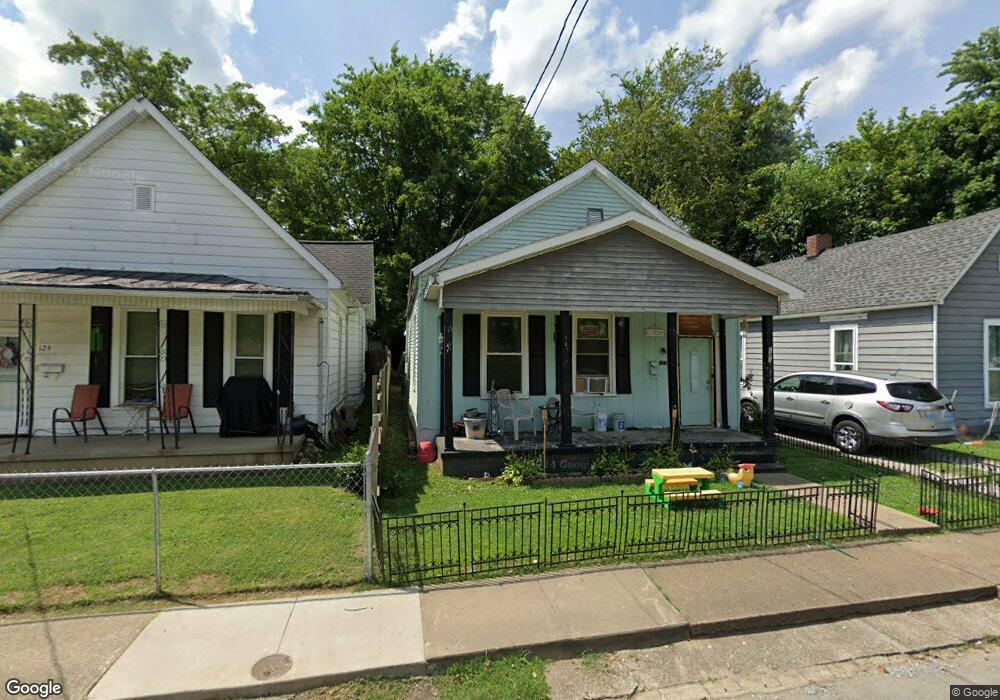
121 S Ingram St Henderson, KY 42420
Downtown Henderson NeighborhoodEstimated Value: $52,006 - $543,000
3
Beds
1
Bath
1,176
Sq Ft
$168/Sq Ft
Est. Value
About This Home
This home is located at 121 S Ingram St, Henderson, KY 42420 and is currently estimated at $197,752, approximately $168 per square foot. 121 S Ingram St is a home located in Henderson County with nearby schools including Jefferson Elementary School, Henderson County South Middle School, and Henderson County High School.
Ownership History
Date
Name
Owned For
Owner Type
Purchase Details
Closed on
Feb 2, 2023
Sold by
Mojica Nixy Isabella
Bought by
Turner Ilizabeth D
Current Estimated Value
Purchase Details
Closed on
Mar 9, 2017
Sold by
Turner Elizabeth D and Turner Michael
Bought by
Sharp Wanda Gail and Mojica Nixy Isabella
Purchase Details
Closed on
Mar 2, 2016
Sold by
Farley Tina Marie and Farley Jarrod Thomas
Bought by
Martinez Elizabeth D
Purchase Details
Closed on
Feb 10, 2009
Sold by
Duncan Corbett S and Duncan Alma
Bought by
Farley Franklin E and Farley Janet M
Home Financials for this Owner
Home Financials are based on the most recent Mortgage that was taken out on this home.
Original Mortgage
$17,000
Interest Rate
5.03%
Mortgage Type
Unknown
Create a Home Valuation Report for This Property
The Home Valuation Report is an in-depth analysis detailing your home's value as well as a comparison with similar homes in the area
Home Values in the Area
Average Home Value in this Area
Purchase History
| Date | Buyer | Sale Price | Title Company |
|---|---|---|---|
| Turner Ilizabeth D | -- | None Listed On Document | |
| Sharp Wanda Gail | -- | None Available | |
| Martinez Elizabeth D | $25,000 | None Available | |
| Farley Franklin E | $26,000 | None Available |
Source: Public Records
Mortgage History
| Date | Status | Borrower | Loan Amount |
|---|---|---|---|
| Previous Owner | Farley Franklin E | $17,000 |
Source: Public Records
Tax History
| Year | Tax Paid | Tax Assessment Tax Assessment Total Assessment is a certain percentage of the fair market value that is determined by local assessors to be the total taxable value of land and additions on the property. | Land | Improvement |
|---|---|---|---|---|
| 2025 | -- | $25,000 | $0 | $0 |
| 2024 | $277 | $25,000 | $0 | $0 |
| 2023 | $280 | $25,000 | $0 | $0 |
| 2022 | $277 | $25,000 | $0 | $0 |
| 2021 | $277 | $25,000 | $0 | $0 |
| 2020 | $271 | $25,000 | $0 | $0 |
| 2019 | $266 | $25,000 | $0 | $0 |
| 2018 | $266 | $25,000 | $0 | $0 |
| 2017 | $0 | $25,000 | $0 | $0 |
| 2016 | $227 | $25,000 | $0 | $0 |
| 2014 | $227 | $25,000 | $4,000 | $21,000 |
Source: Public Records
Map
Nearby Homes
- 129 S Ingram St
- 117 S Ingram St
- 131 S Ingram St
- 135 S Ingram St
- 436 Washington St
- 426 Washington St
- 424 Washington St
- 130 S Ingram St
- 435 Powell St
- 425 Powell St
- 500 Washington St
- 508 Washington St
- 501 Powell St
- 419 Powell St
- 503 Powell St
- 516 Washington St
- 513 Powell St
- 515 Powell St
- 34 S Ingram St
- 111 S Adams St
Your Personal Tour Guide
Ask me questions while you tour the home.