D
Landlord's Agent in 2025
David Schmiediche
Keller Williams Realty Brazos Valley office
(979) 739-0921
52 Total Sales
Estimated Value: $253,717 - $417,000
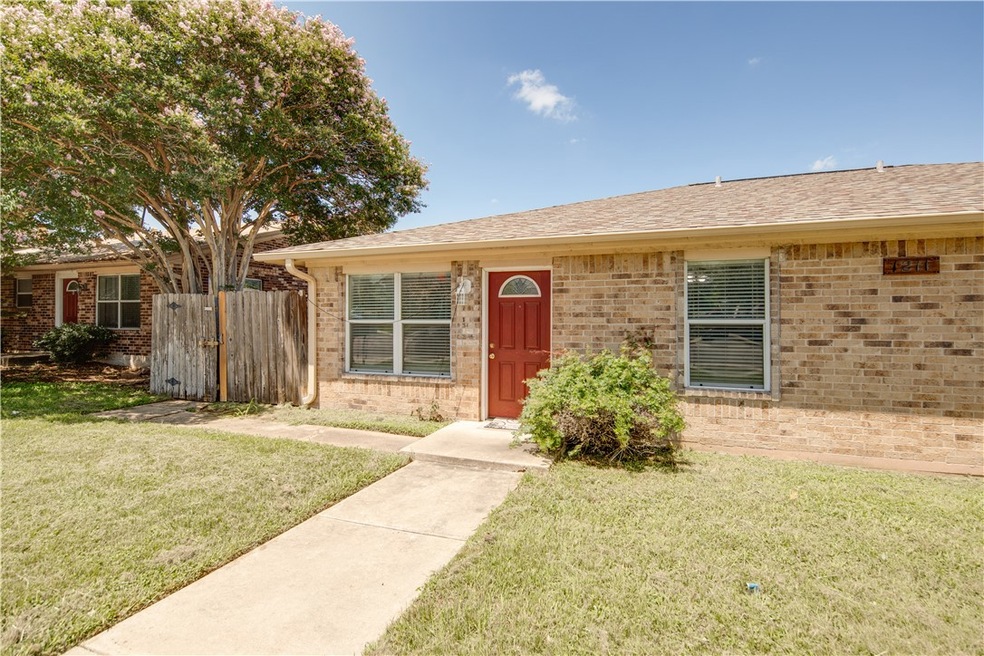
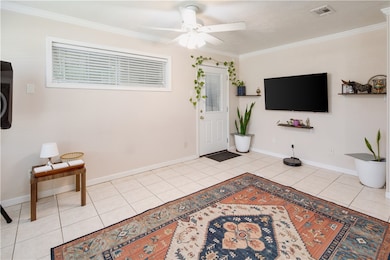
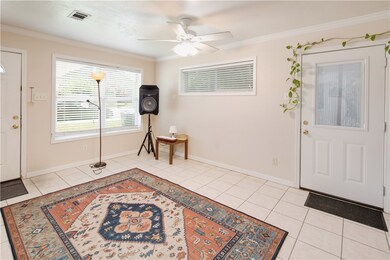
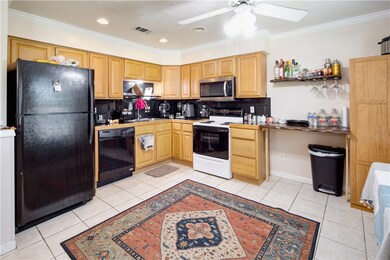
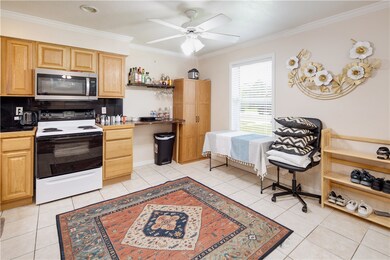
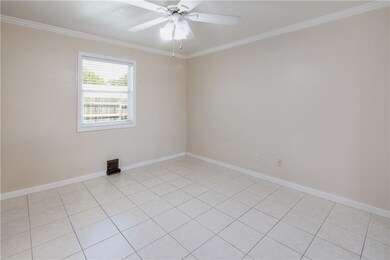
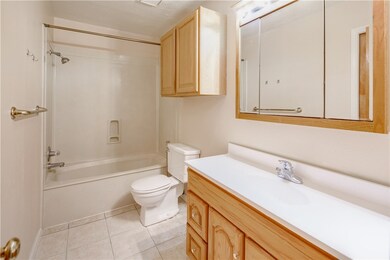
AUGUST MOVE IN!!! Welcome to your new home! This charming rental offers 2 bedrooms, 2 bathrooms, and 960 sqft of comfortable living space, perfectly suited for families, or professionals, including an attached two car garage. Located in a vibrant community with easy access to the highway, your daily commute will be a breeze. The open-concept living and dining areas provide plenty of room for relaxation and entertainment, while the modern kitchen, equipped with appliances, ample counter space, and plenty of storage, makes meal prep a delight. Two generously sized bedrooms ensure everyone has their own private retreat, and the two full bathrooms feature modern fixtures and finishes for your convenience. Enjoy the proximity to Texas A&M, just a short drive away. The area is bustling with a variety of nearby small businesses, including cafes, shops, and services. Don't miss this opportunity to live in a desirable location with everything you need within reach. Schedule a viewing today and make this wonderful property your next home!!!
Last Agent to Rent the Property
Keller Williams Realty Brazos Valley office License #0721430 Listed on: 04/07/2025

| Date | Buyer | Sale Price | Title Company |
|---|---|---|---|
| Berner Ventures Llc Series 103 | -- | None Available |
| Date | Event | Price | List to Sale | Price per Sq Ft |
|---|---|---|---|---|
| 05/12/2025 05/12/25 | Rented | $1,150 | 0.0% | -- |
| 04/28/2025 04/28/25 | Under Contract | -- | -- | -- |
| 04/07/2025 04/07/25 | For Rent | $1,150 | -- | -- |
| Year | Tax Paid | Tax Assessment Tax Assessment Total Assessment is a certain percentage of the fair market value that is determined by local assessors to be the total taxable value of land and additions on the property. | Land | Improvement |
|---|---|---|---|---|
| 2025 | $4,166 | $242,411 | $62,000 | $180,411 |
| 2024 | $4,166 | $218,609 | $61,000 | $157,609 |
| 2023 | $4,166 | $234,062 | $60,500 | $173,562 |
| 2022 | $4,082 | $191,439 | $55,000 | $136,439 |
| 2021 | $3,971 | $175,800 | $55,000 | $120,800 |
| 2020 | $3,993 | $175,800 | $55,000 | $120,800 |
| 2019 | $4,028 | $170,480 | $55,000 | $115,480 |
| 2018 | $3,725 | $156,470 | $50,000 | $106,470 |
| 2017 | $3,610 | $153,400 | $50,000 | $103,400 |
| 2016 | $2,871 | $122,000 | $50,000 | $72,000 |
| 2015 | $2,504 | $120,360 | $50,000 | $70,360 |
| 2014 | $2,504 | $108,047 | $50,000 | $58,047 |
D
Landlord's Agent in 2025
David Schmiediche
Keller Williams Realty Brazos Valley office
(979) 739-0921
52 Total Sales
A
Tenant's Agent in 2025
Arin Serna
BHHS Caliber Realty
(979) 492-2603
Source: Bryan-College Station Regional Multiple Listing Service
MLS Number: 25004245
APN: 45707
Disclaimer: Certain information contained herein is derived from information provided by parties other than Homes.com. All information provided is deemed reliable, but is not guaranteed to be accurate and should be independently verified.
![]() IDX information is provided exclusively for personal, non-commercial use, and may not be used for any purpose other than to identify prospective properties consumers may be interested in purchasing.
IDX information is provided exclusively for personal, non-commercial use, and may not be used for any purpose other than to identify prospective properties consumers may be interested in purchasing.
Information is deemed reliable but not guaranteed.
Ask me questions while you tour the home.