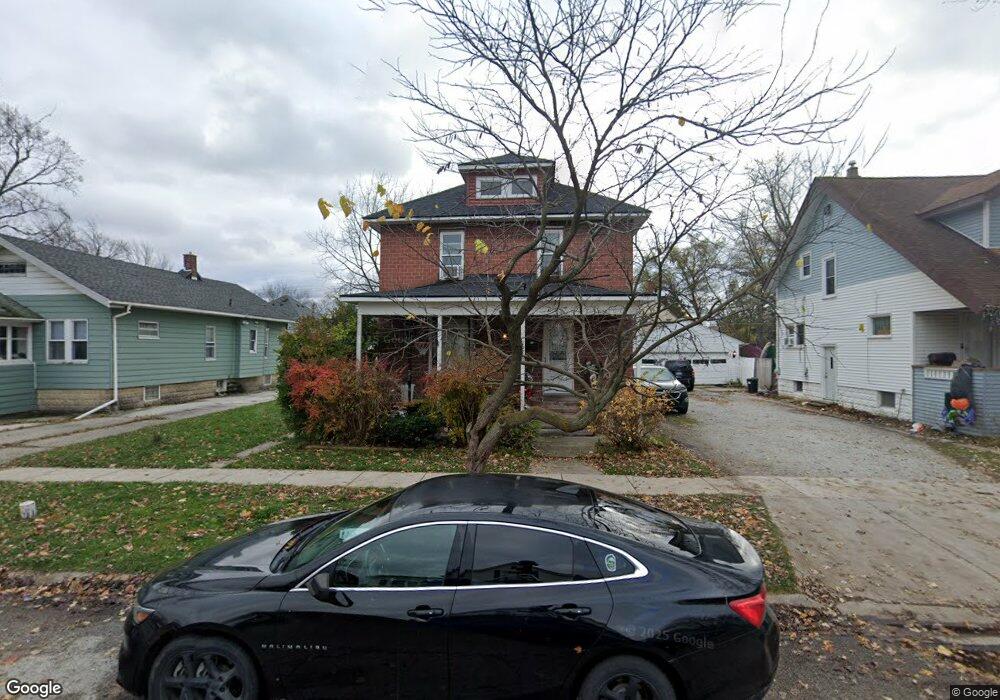
1212 Wall St Port Huron, MI 48060
Estimated Value: $144,000 - $159,000
4
Beds
1
Bath
1,452
Sq Ft
$104/Sq Ft
Est. Value
About This Home
This home is located at 1212 Wall St, Port Huron, MI 48060 and is currently estimated at $150,592, approximately $103 per square foot. 1212 Wall St is a home located in St. Clair County with nearby schools including Woodrow Wilson Elementary School, Central Middle School, and Port Huron High School.
Ownership History
Date
Name
Owned For
Owner Type
Purchase Details
Closed on
Aug 18, 2023
Sold by
Murray Robert G
Bought by
Murray Ann
Current Estimated Value
Purchase Details
Closed on
Aug 6, 2018
Sold by
Annie Murray
Bought by
Murray Robert G
Purchase Details
Closed on
Aug 31, 2011
Sold by
Fannie Mae
Bought by
Murray Robert G and Murray Annie
Purchase Details
Closed on
Jan 28, 2011
Sold by
Phh Mortgage Corporation
Bought by
Federal National Mortgage Association
Purchase Details
Closed on
Jan 20, 2011
Sold by
Sackitt Richard A and Sackitt Dlynn S
Bought by
Phh Mortgage Corporation and Cendant Mortgage Corporation
Create a Home Valuation Report for This Property
The Home Valuation Report is an in-depth analysis detailing your home's value as well as a comparison with similar homes in the area
Home Values in the Area
Average Home Value in this Area
Purchase History
| Date | Buyer | Sale Price | Title Company |
|---|---|---|---|
| Murray Ann | -- | None Listed On Document | |
| Murray Robert G | -- | None Listed On Document | |
| Murray Robert G | $18,000 | None Available | |
| Federal National Mortgage Association | -- | None Available | |
| Phh Mortgage Corporation | $88,003 | None Available |
Source: Public Records
Tax History
| Year | Tax Paid | Tax Assessment Tax Assessment Total Assessment is a certain percentage of the fair market value that is determined by local assessors to be the total taxable value of land and additions on the property. | Land | Improvement |
|---|---|---|---|---|
| 2025 | $1,385 | $65,500 | $0 | $0 |
| 2024 | $1,350 | $62,200 | $0 | $0 |
| 2023 | $1,275 | $55,200 | $0 | $0 |
| 2022 | $1,300 | $46,100 | $0 | $0 |
| 2020 | $1,248 | $37,000 | $37,000 | $0 |
| 2019 | $1,226 | $27,800 | $0 | $0 |
| 2018 | $1,199 | $27,800 | $0 | $0 |
| 2017 | $1,072 | $26,900 | $0 | $0 |
| 2016 | $910 | $26,900 | $0 | $0 |
| 2015 | $893 | $26,300 | $26,300 | $0 |
| 2014 | $893 | $24,900 | $24,900 | $0 |
| 2013 | -- | $25,000 | $0 | $0 |
Source: Public Records
Map
Nearby Homes
Your Personal Tour Guide
Ask me questions while you tour the home.