1218 43rd Ave Greeley, CO 80634
Greeley AreaEstimated Value: $559,835 - $636,000
About This Home
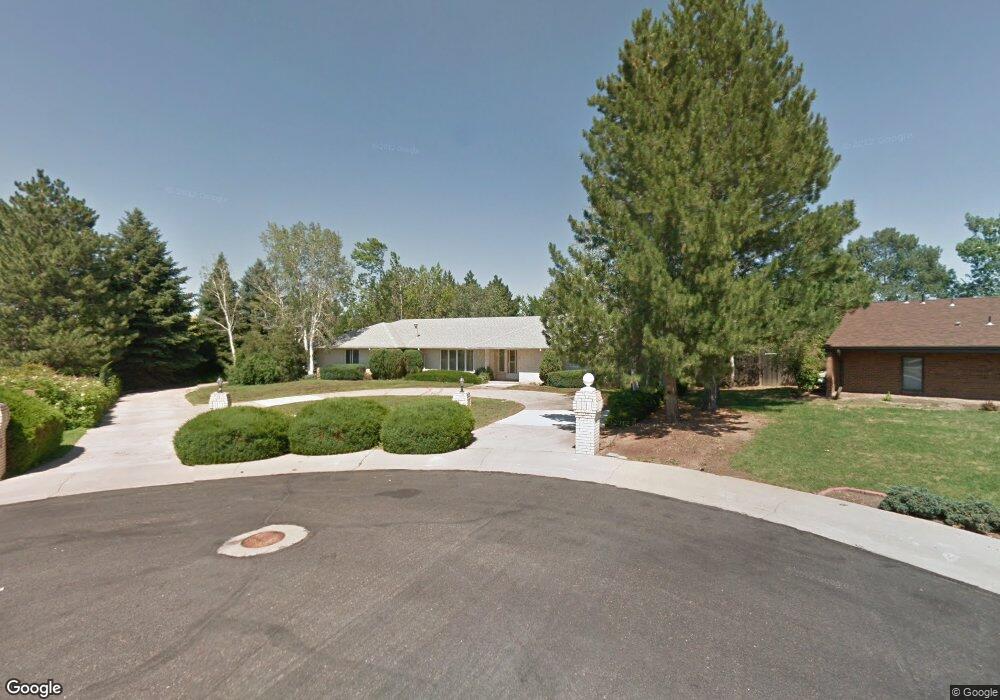
This home is located at 1218 43rd Ave, Greeley, CO 80634 and is currently estimated at $605,459, approximately $229 per square foot. 1218 43rd Ave is a home located in Weld County with nearby schools including Scott Elementary School, Heath Middle School, and Greeley Central High School.
Ownership History
We collect this data history from publicly available records. To have your information removed, we recommend requesting removal directly through your county’s website.
Purchase Details
Home Financials for this Owner
Home Financials are based on the most recent Mortgage that was taken out on this home.Purchase Details
Purchase Details
Home Financials for this Owner
Home Financials are based on the most recent Mortgage that was taken out on this home.Purchase Details
Purchase Details
Purchase Details
Purchase History
We collect this data history from publicly available records. To have your information removed, we recommend requesting removal directly through your county’s website.
| Date | Buyer | Sale Price | Title Company |
|---|---|---|---|
| $190,000 | Assured Title | ||
| -- | None Available | ||
| $265,000 | Land Title Guarantee Company | ||
| $225,000 | -- | ||
| $191,000 | -- | ||
| -- | -- |
Mortgage History
We collect this data history from publicly available records. To have your information removed, we recommend requesting removal directly through your county’s website.
| Date | Status | Borrower | Loan Amount |
|---|---|---|---|
| Closed | -- | ||
| Open | $500,000,000 | ||
| Closed | $161,500 | ||
| Previous Owner | $251,000 | ||
| Previous Owner | $64,000 | ||
| Previous Owner | $232,800 | ||
| Previous Owner | $29,000 | ||
| Previous Owner | $251,750 |
Tax History
We collect this data history from publicly available records. To have your information removed, we recommend requesting removal directly through your county’s website.
| Year | Tax Paid | Tax Assessment Tax Assessment Total Assessment is a certain percentage of the fair market value that is determined by local assessors to be the total taxable value of land and additions on the property. | Land | Improvement |
|---|---|---|---|---|
| 2026 | $2,948 | $31,620 | $5,510 | $26,110 |
| 2025 | $2,530 | $32,290 | $5,630 | $26,660 |
| 2024 | $2,412 | $33,510 | $5,760 | $27,750 |
| 2023 | $2,412 | $33,840 | $5,820 | $28,020 |
| 2022 | $2,510 | $28,780 | $5,980 | $22,800 |
| 2021 | $2,589 | $29,610 | $6,150 | $23,460 |
| 2020 | $2,353 | $26,990 | $4,930 | $22,060 |
| 2019 | $2,359 | $26,990 | $4,930 | $22,060 |
| 2018 | $1,986 | $23,980 | $4,320 | $19,660 |
| 2017 | $1,997 | $23,980 | $4,320 | $19,660 |
| 2016 | $1,659 | $22,420 | $3,500 | $18,920 |
| 2015 | $1,653 | $22,420 | $3,500 | $18,920 |
| 2014 | $1,392 | $18,420 | $3,180 | $15,240 |
Map
- 5 Ward Dr Unit 15D
- 1200 43rd Ave Unit 1
- 4070 W 11th St Unit 13
- 39 Ward Dr Unit 104
- 4040 W 12th St Unit 6
- 4507 W 14th St
- 4261 W 15th Street Ln
- 4285 W 15th Street Ln
- 3950 W 12th St Unit 22
- 3950 W 12th St Unit 38
- 915 44th Avenue Ct Unit 2
- 1501 45th Ave
- 4606 W 14th St
- 4422 W 9th St
- 727 41st Avenue Ct
- 1009 47th Ave
- 4630 W 14th St
- 4481 W Pioneer Dr Unit 83
- 4483 W Pioneer Dr Unit 84
- 824 37th Avenue Ct Unit 824
Ask me questions while you tour the home.