122 Flyatt Rd Tabernacle, NJ 08088
Estimated Value: $386,276 - $553,000
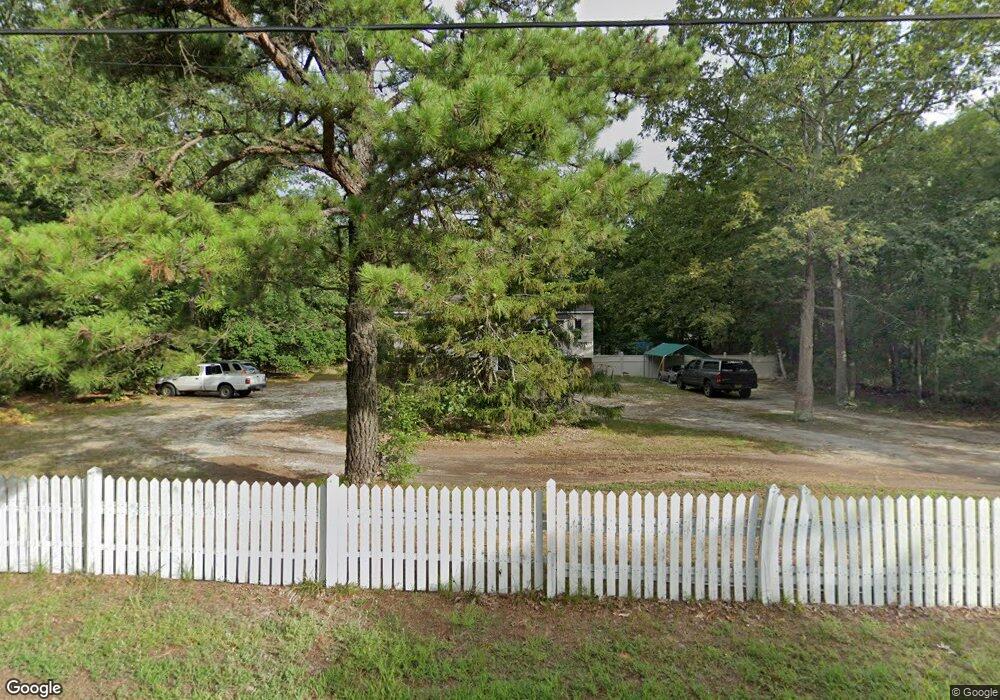
About This Home
This home is located at 122 Flyatt Rd, Tabernacle, NJ 08088 and is currently estimated at $457,569, approximately $221 per square foot. 122 Flyatt Rd is a home located in Burlington County with nearby schools including Tabernacle Elementary School, Seneca High School, and Shawnee High School.
Ownership History
We collect this data history from publicly available records. To have your information removed, we recommend requesting removal directly through your county’s website.
Purchase Details
Home Financials for this Owner
Home Financials are based on the most recent Mortgage that was taken out on this home.Purchase Details
Purchase Details
Home Values in the Area
Average Home Value in this Area
Purchase History
We collect this data history from publicly available records. To have your information removed, we recommend requesting removal directly through your county’s website.
| Date | Buyer | Sale Price | Title Company |
|---|---|---|---|
| $94,900 | Security First Title Partner | ||
| -- | -- | ||
| -- | -- |
Mortgage History
We collect this data history from publicly available records. To have your information removed, we recommend requesting removal directly through your county’s website.
| Date | Status | Borrower | Loan Amount |
|---|---|---|---|
| Previous Owner | $94,836 |
Tax History
We collect this data history from publicly available records. To have your information removed, we recommend requesting removal directly through your county’s website.
| Year | Tax Paid | Tax Assessment Tax Assessment Total Assessment is a certain percentage of the fair market value that is determined by local assessors to be the total taxable value of land and additions on the property. | Land | Improvement |
|---|---|---|---|---|
| 2025 | $6,144 | $185,500 | $78,800 | $106,700 |
| 2024 | $5,628 | $185,500 | $78,800 | $106,700 |
| 2023 | $5,628 | $185,500 | $78,800 | $106,700 |
| 2022 | $5,457 | $185,500 | $78,800 | $106,700 |
| 2021 | $5,554 | $185,500 | $78,800 | $106,700 |
| 2020 | $5,626 | $185,500 | $78,800 | $106,700 |
| 2019 | $5,457 | $185,500 | $78,800 | $106,700 |
| 2018 | $5,357 | $185,500 | $78,800 | $106,700 |
| 2017 | $5,324 | $185,500 | $78,800 | $106,700 |
| 2016 | $5,159 | $185,500 | $78,800 | $106,700 |
| 2015 | $5,114 | $185,500 | $78,800 | $106,700 |
| 2014 | $4,912 | $185,500 | $78,800 | $106,700 |
Map
- 81 Flyatt Rd
- 2 Teaberry Ct
- 11 Hidden Acres Dr
- 863 Mckendimen Rd
- 145 Tuckerton Rd
- 131 Tuckerton Rd
- 229 Oakshade Rd
- 227 Oakshade Rd
- 30 Muskingum Dr
- 417 Medford Lakes Rd
- 4 Ridge Ct
- 57 Red Oak Dr
- 496 Medford Lakes Rd
- 1332 Old Indian Mills Rd
- 581 Mckendimen Rd
- 1531 U S 206
- 8 Candle Ct
- 8 Minisink Trail
- 318 A Carranza Rd
- 45 Lakeview Dr
Ask me questions while you tour the home.