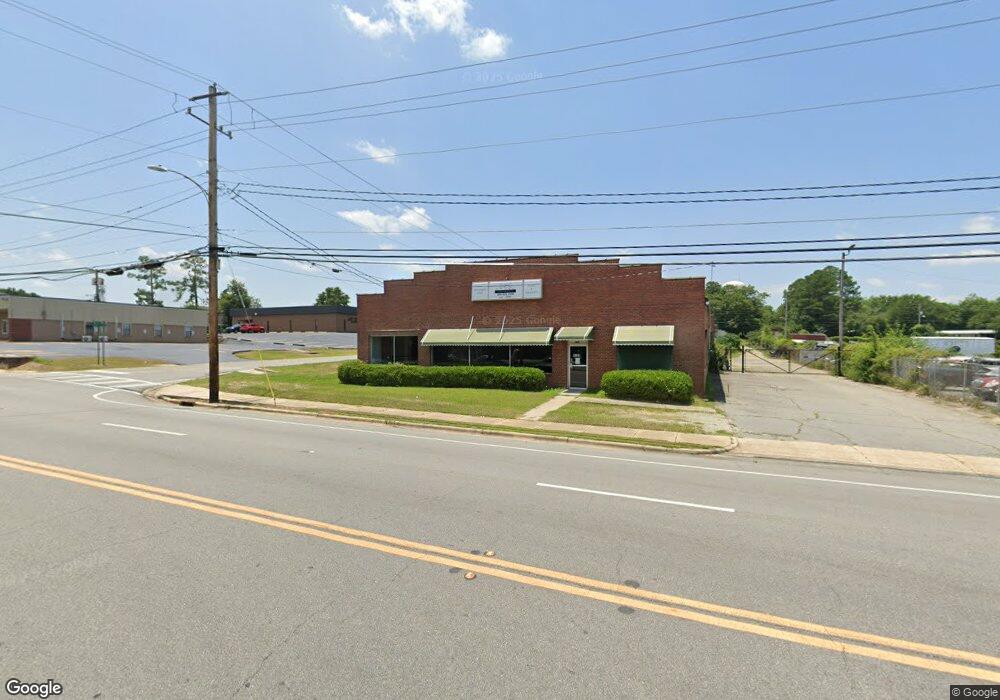
1220 S 7th St Cordele, GA 31015
Estimated Value: $115,000 - $143,000
3
Beds
1
Bath
1,857
Sq Ft
$69/Sq Ft
Est. Value
About This Home
This home is located at 1220 S 7th St, Cordele, GA 31015 and is currently estimated at $128,007, approximately $68 per square foot. 1220 S 7th St is a home located in Crisp County with nearby schools including Crisp County Elementary School, Crisp County Primary School, and Crisp County Middle School.
Ownership History
Date
Name
Owned For
Owner Type
Purchase Details
Closed on
Jan 11, 2021
Sold by
Felton Larry D
Bought by
Buxani Raju and Buxani Chitra
Current Estimated Value
Purchase Details
Closed on
Aug 3, 2020
Sold by
Harden Robert
Bought by
Felton Larry D
Purchase Details
Closed on
Oct 18, 2000
Sold by
Jones Terry and Jones Jerry
Bought by
Harden Robert
Purchase Details
Closed on
Dec 8, 1995
Bought by
Jones Terry and Jones Jerry
Purchase Details
Closed on
Mar 9, 1993
Bought by
Jones Terry and Jones Jerry
Purchase Details
Closed on
May 1, 1991
Bought by
Felton Larry D
Create a Home Valuation Report for This Property
The Home Valuation Report is an in-depth analysis detailing your home's value as well as a comparison with similar homes in the area
Purchase History
We collect this data history from publicly available records. To have your information removed, we recommend requesting removal directly through your county’s website.
| Date | Buyer | Sale Price | Title Company |
|---|---|---|---|
| Buxani Raju | -- | -- | |
| Felton Larry D | -- | -- | |
| Harden Robert | $34,000 | -- | |
| Jones Terry | -- | -- | |
| Jones Terry | $28,000 | -- | |
| Felton Larry D | $60,000 | -- |
Source: Public Records
Tax History
| Year | Tax Paid | Tax Assessment Tax Assessment Total Assessment is a certain percentage of the fair market value that is determined by local assessors to be the total taxable value of land and additions on the property. | Land | Improvement |
|---|---|---|---|---|
| 2025 | $1,260 | $35,709 | $1,360 | $34,349 |
| 2024 | $1,146 | $31,965 | $1,360 | $30,605 |
| 2023 | $1,128 | $30,094 | $1,360 | $28,734 |
| 2022 | $746 | $28,222 | $1,360 | $26,862 |
| 2021 | $738 | $26,350 | $1,360 | $24,990 |
| 2020 | $742 | $26,350 | $1,360 | $24,990 |
| 2019 | $747 | $26,350 | $1,360 | $24,990 |
| 2018 | $456 | $15,478 | $2,176 | $13,302 |
| 2017 | $629 | $15,478 | $2,176 | $13,302 |
| 2016 | $458 | $15,478 | $2,176 | $13,302 |
| 2015 | -- | $15,478 | $2,176 | $13,302 |
| 2014 | -- | $15,478 | $2,176 | $13,302 |
| 2013 | -- | $15,478 | $2,176 | $13,302 |
Source: Public Records
Map
Nearby Homes
- 316 E 23rd Ave
- 314 W 25th Ave
- 1506 S Joe Wright Dr
- 1604 S 11th St
- 511 E 25th Ave
- 601 E 26th Ave
- 551 N Cedar
- 708 E 26th Ave Unit 4&5
- 708 E 26th Ave
- 718 E 22nd Ave
- 723 E 24th Ave
- 312 E 14th Ave
- 708 E 27th Ave
- 720 E 20th Ave
- 710 W 17th Ave
- 716 E 18th Ave
- 1002 Camellia Dr
- 610 E 15th Ave
- E 8th Ave
- 1105 Camellia Dr
Your Personal Tour Guide
Ask me questions while you tour the home.