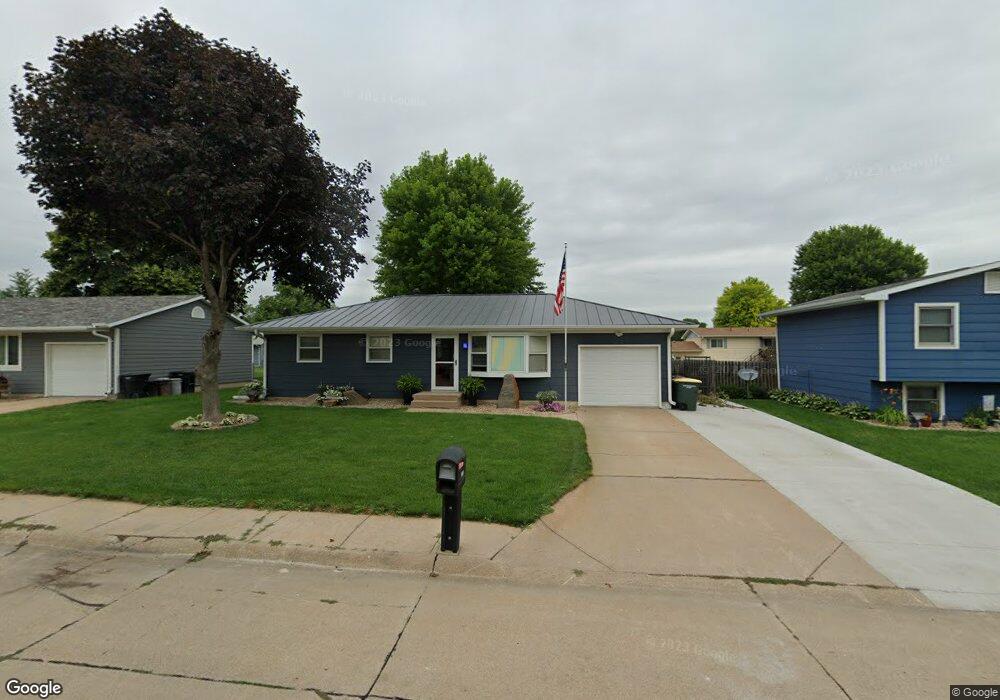
1221 E 5th St Hastings, NE 68901
Estimated Value: $214,000 - $230,000
3
Beds
2
Baths
1,064
Sq Ft
$209/Sq Ft
Est. Value
About This Home
This home is located at 1221 E 5th St, Hastings, NE 68901 and is currently estimated at $222,520, approximately $209 per square foot. 1221 E 5th St is a home located in Adams County with nearby schools including Hastings Senior High School, St. Michael's Preschool & Elementary School, and St. Cecilia High School.
Ownership History
Date
Name
Owned For
Owner Type
Purchase Details
Closed on
Oct 15, 2012
Sold by
Killer Joshua D and Killer Melanie A
Bought by
Busboom Gene B and Busboom Margo A
Current Estimated Value
Purchase Details
Closed on
Jul 12, 2007
Sold by
Meier Alois J and Meier Peggy S
Bought by
Kiiker Joshua D and Kiiker Melanie A
Home Financials for this Owner
Home Financials are based on the most recent Mortgage that was taken out on this home.
Original Mortgage
$90,900
Interest Rate
6.41%
Mortgage Type
New Conventional
Create a Home Valuation Report for This Property
The Home Valuation Report is an in-depth analysis detailing your home's value as well as a comparison with similar homes in the area
Home Values in the Area
Average Home Value in this Area
Purchase History
| Date | Buyer | Sale Price | Title Company |
|---|---|---|---|
| Busboom Gene B | $116,000 | Adams Land Title | |
| Kiiker Joshua D | $101,000 | None Available |
Source: Public Records
Mortgage History
| Date | Status | Borrower | Loan Amount |
|---|---|---|---|
| Previous Owner | Kiiker Joshua D | $90,900 |
Source: Public Records
Tax History
| Year | Tax Paid | Tax Assessment Tax Assessment Total Assessment is a certain percentage of the fair market value that is determined by local assessors to be the total taxable value of land and additions on the property. | Land | Improvement |
|---|---|---|---|---|
| 2025 | $2,715 | $173,623 | $21,000 | $152,623 |
| 2024 | $2,386 | $150,341 | $21,000 | $129,341 |
| 2023 | $3,049 | $147,753 | $21,000 | $126,753 |
| 2022 | $3,509 | $155,783 | $21,000 | $134,783 |
| 2021 | $2,961 | $135,027 | $15,750 | $119,277 |
| 2020 | $2,789 | $129,347 | $15,750 | $113,597 |
| 2019 | $2,712 | $127,120 | $15,750 | $111,370 |
| 2018 | $2,546 | $118,720 | $7,350 | $111,370 |
| 2017 | $2,452 | $114,435 | $0 | $0 |
| 2016 | $2,409 | $112,335 | $7,350 | $104,985 |
| 2011 | -- | $0 | $0 | $0 |
Source: Public Records
Map
Nearby Homes
- 611 Thomas Dr Unit 611
- 616 N 4th Ave
- 618 Thomas Dr Unit 618
- 1103-1105 E 6th St
- 6 Maywood Dr
- 1011 E 7th St
- 907 E 6th St
- 1210 University St
- 12 Avalon Ln
- 1 Windsor Dr
- 1120 Pleasant St
- 730 E 6th St
- 747 E 2nd St
- 724 E 5th St
- 519 E 7th St
- 411 University Ave
- 218 E 4th St
- 214 E 7th St
- 211 S California Ave
- 224 E 9th St
Your Personal Tour Guide
Ask me questions while you tour the home.