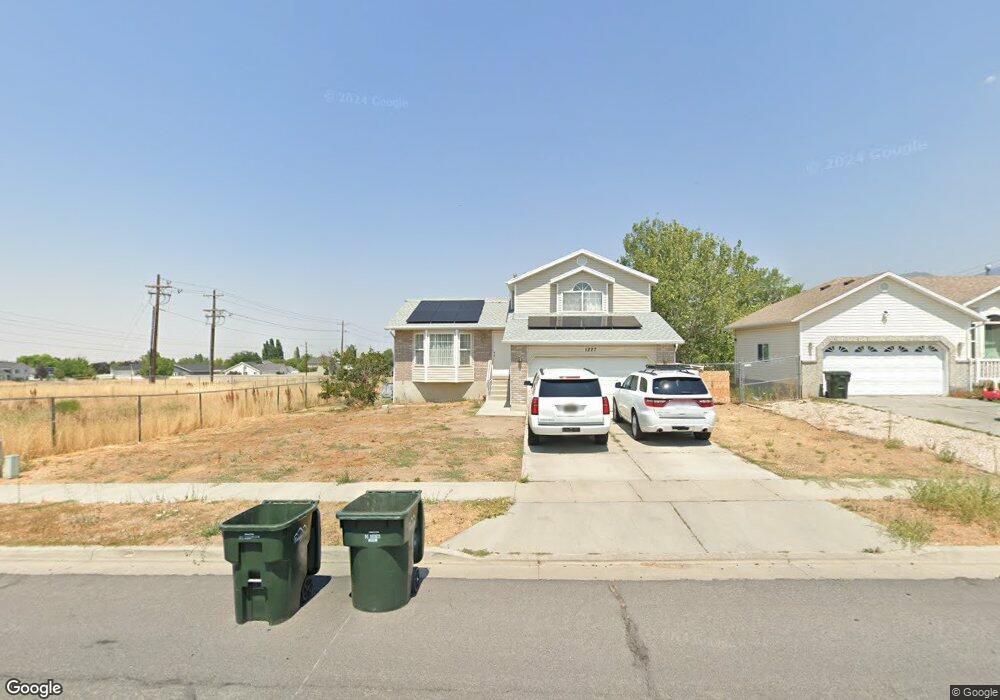
1227 E 970 N Tooele, UT 84074
Estimated Value: $405,387 - $477,000
3
Beds
2
Baths
2,019
Sq Ft
$213/Sq Ft
Est. Value
About This Home
This home is located at 1227 E 970 N, Tooele, UT 84074 and is currently estimated at $429,597, approximately $212 per square foot. 1227 E 970 N is a home located in Tooele County with nearby schools including Middle Canyon Elementary School, Tooele Junior High School, and Tooele High School.
Ownership History
Date
Name
Owned For
Owner Type
Purchase Details
Closed on
Apr 12, 2022
Sold by
Anderson Peter C and Anderson Stephenie J
Bought by
Dela Cruz Perez Jose Angel
Current Estimated Value
Purchase Details
Closed on
Sep 5, 2008
Sold by
Anderson Pete
Bought by
Anderson Stephenie J
Create a Home Valuation Report for This Property
The Home Valuation Report is an in-depth analysis detailing your home's value as well as a comparison with similar homes in the area
Purchase History
| Date | Buyer | Sale Price | Title Company |
|---|---|---|---|
| Dela Cruz Perez Jose Angel | -- | Guarantee Title | |
| Anderson Stephenie J | -- | None Available |
Source: Public Records
Tax History
| Year | Tax Paid | Tax Assessment Tax Assessment Total Assessment is a certain percentage of the fair market value that is determined by local assessors to be the total taxable value of land and additions on the property. | Land | Improvement |
|---|---|---|---|---|
| 2025 | $2,588 | $392,481 | $100,000 | $292,481 |
| 2024 | $2,745 | $209,510 | $55,000 | $154,510 |
| 2023 | $2,745 | $203,409 | $52,383 | $151,026 |
| 2022 | $2,382 | $204,970 | $51,906 | $153,064 |
| 2021 | $1,925 | $138,505 | $20,763 | $117,742 |
| 2020 | $1,848 | $230,611 | $37,750 | $192,861 |
| 2019 | $1,735 | $213,078 | $37,750 | $175,328 |
| 2018 | $1,620 | $188,583 | $40,000 | $148,583 |
| 2017 | $1,405 | $194,044 | $30,000 | $164,044 |
| 2016 | $1,152 | $94,956 | $16,500 | $78,456 |
| 2015 | $1,152 | $83,799 | $0 | $0 |
| 2014 | -- | $83,799 | $0 | $0 |
Source: Public Records
Map
Nearby Homes
- 1224 E 970 N
- 932 N 1250 E
- 1046 Cedarwood Rd
- 993 White Pine Dr
- 208 E 850 N Unit A
- 224 E 850 N St Unit A
- 224 E 850 N Unit D
- 208 E 850 N Unit C
- 238 E 850 St N Unit D
- 802 E 1120 N
- 1266 E 850 N
- 647 E 980 N
- 1194 N 690 E
- 677 Kings Landing
- 936 N 580 E
- 743 N 690 E
- 1148 N 550 E
- 618 E 670 N
- 518 E 740 N
- 180 1000 N
Your Personal Tour Guide
Ask me questions while you tour the home.