K
Seller's Agent in 2026
Kaylin Southern
Refined Realty
(208) 553-1933
4 in this area
49 Total Sales
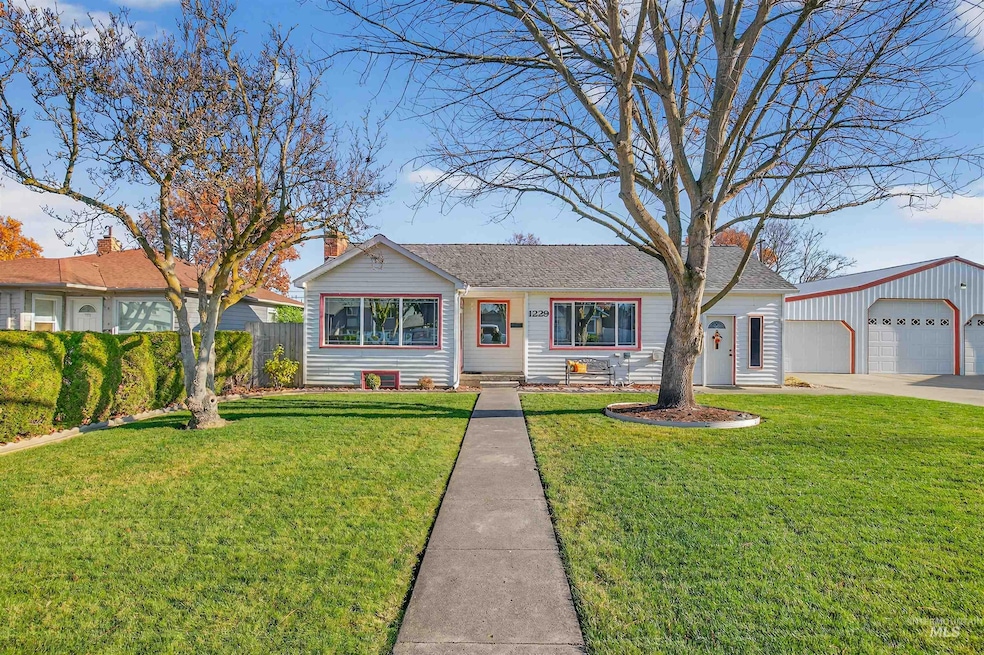
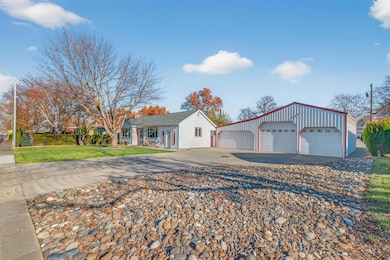
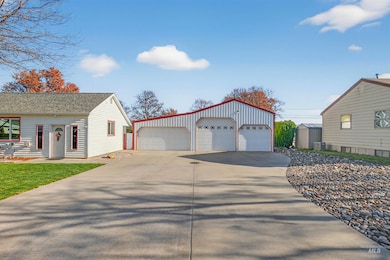
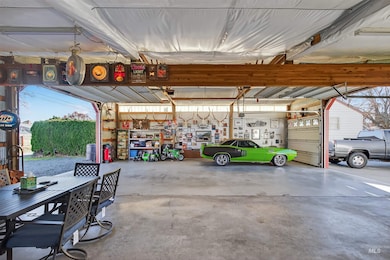
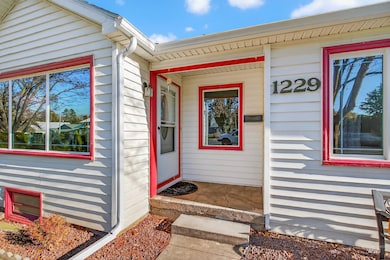
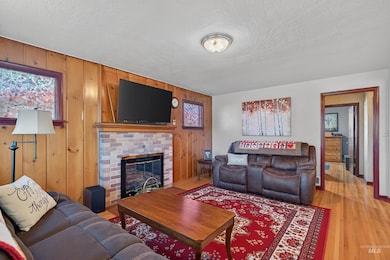

The Most Meticulously Maintained Clarkston Home just hit the market! Welcome to 1229 6th Street. A beautifully cared-for home in the heart of Clarkston. This charming home features 3 Bedrooms, 2 Bathrooms and is completed with a Drive-Through Shop! An inviting layout filled with natural light. From the spotless kitchen to the warm and welcoming living spaces, every inch of this home reflects pride of ownership. Step outside and discover one of the property’s biggest highlights—the massive 36x42 drive-through shop with alley access. Complete with oversized doors, concrete floors, a wood stove, gas heat, A/C, abundant storage, and plenty of room for hobbies, vehicles, and projects. This shop is a dream come true for car enthusiasts, outdoorsmen, or anyone needing workspace. The home sits on a beautifully maintained double lot, a fully fenced back yard, great landscaping, and plenty of parking. Conveniently located near schools, shopping, and parks—this is a rare find offering both comfort and unmatched functionality.
Last Agent to Sell the Property
Refined Realty Brokerage Phone: 208-848-6686 Listed on: 11/20/2025
Last Buyer's Agent
Refined Realty Brokerage Phone: 208-848-6686 Listed on: 11/20/2025
| Date | Type | Sale Price | Title Company |
|---|---|---|---|
| Warranty Deed | $399,900 | Alliance Title | |
| Interfamily Deed Transfer | -- | None Available | |
| Quit Claim Deed | -- | First American Title Co |
| Date | Status | Loan Amount | Loan Type |
|---|---|---|---|
| Open | $392,656 | FHA | |
| Previous Owner | $133,000 | New Conventional |
| Date | Event | Price | List to Sale | Price per Sq Ft |
|---|---|---|---|---|
| 01/05/2026 01/05/26 | Sold | -- | -- | -- |
| 12/02/2025 12/02/25 | Pending | -- | -- | -- |
| 11/20/2025 11/20/25 | For Sale | $399,900 | -- | $177 / Sq Ft |
| Year | Tax Paid | Tax Assessment Tax Assessment Total Assessment is a certain percentage of the fair market value that is determined by local assessors to be the total taxable value of land and additions on the property. | Land | Improvement |
|---|---|---|---|---|
| 2025 | $603 | $191,600 | $30,000 | $161,600 |
| 2023 | $603 | $191,600 | $30,000 | $161,600 |
| 2022 | $587 | $191,600 | $30,000 | $161,600 |
| 2021 | $537 | $191,600 | $30,000 | $161,600 |
| 2020 | $2,157 | $191,600 | $30,000 | $161,600 |
| 2019 | $2,061 | $189,300 | $49,000 | $140,300 |
| 2018 | $2,492 | $189,300 | $49,000 | $140,300 |
| 2017 | $2,335 | $189,300 | $49,000 | $140,300 |
| 2016 | $2,335 | $189,300 | $49,000 | $140,300 |
| 2015 | $232 | $183,900 | $49,000 | $134,900 |
| 2013 | $2,342 | $180,000 | $49,000 | $131,000 |
K
Seller's Agent in 2026
Kaylin Southern
Refined Realty
(208) 553-1933
4 in this area
49 Total Sales
Source: Intermountain MLS
MLS Number: 98967994
APN: 1-101-02-008-0000-0000
Disclaimer: Certain information contained herein is derived from information provided by parties other than Homes.com. All information provided is deemed reliable, but is not guaranteed to be accurate and should be independently verified.
![]() IDX information is provided exclusively for consumers’ personal, non-commercial use, that it may not be used for any purpose other than to identify prospective properties consumers may be interested in purchasing. IMLS does not assume any liability for missing or inaccurate data.
IDX information is provided exclusively for consumers’ personal, non-commercial use, that it may not be used for any purpose other than to identify prospective properties consumers may be interested in purchasing. IMLS does not assume any liability for missing or inaccurate data.
Information provided by IMLS is deemed reliable but not guaranteed.
Ask me questions while you tour the home.
