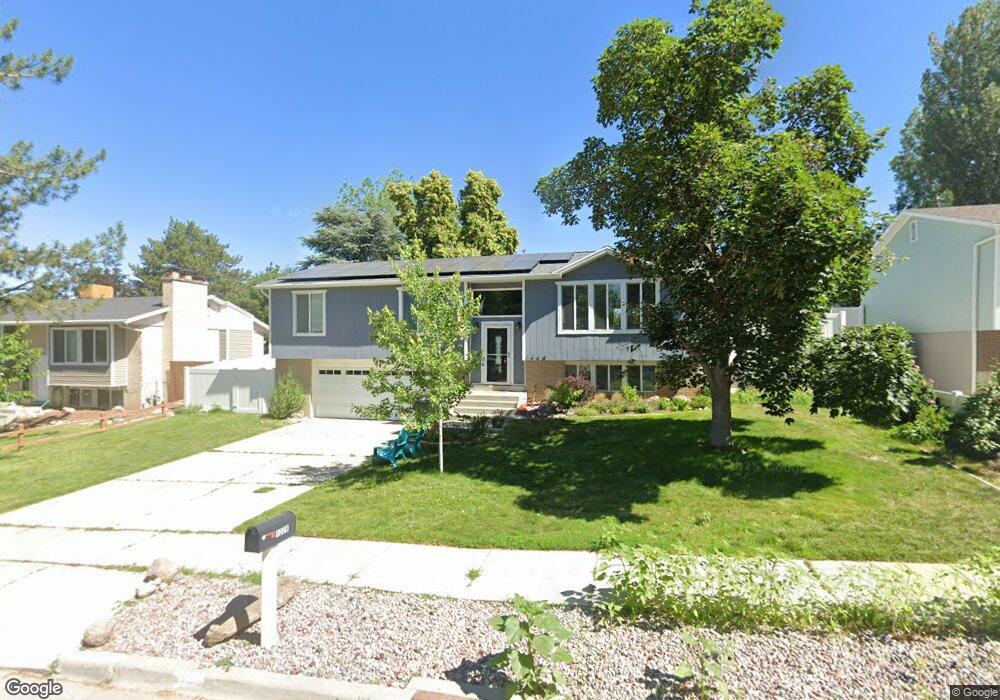
1229 E 8220 S Sandy, UT 84094
Sandy AreaEstimated Value: $516,000 - $601,000
About This Home
This home is located at 1229 E 8220 S, Sandy, UT 84094 and is currently estimated at $570,527, approximately $297 per square foot. 1229 E 8220 S is a home located in Salt Lake County with nearby schools including Peruvian Park Elementary School, Hillcrest High School, and Union Middle School.
Ownership History
We collect this data history from publicly available records. To have your information removed, we recommend requesting removal directly through your county’s website.
Purchase Details
Home Financials for this Owner
Home Financials are based on the most recent Mortgage that was taken out on this home.Purchase Details
Purchase Details
Home Financials for this Owner
Home Financials are based on the most recent Mortgage that was taken out on this home.Purchase Details
Home Financials for this Owner
Home Financials are based on the most recent Mortgage that was taken out on this home.Purchase Details
Home Financials for this Owner
Home Financials are based on the most recent Mortgage that was taken out on this home.Purchase Details
Purchase Details
Home Financials for this Owner
Home Financials are based on the most recent Mortgage that was taken out on this home.Purchase Details
Home Financials for this Owner
Home Financials are based on the most recent Mortgage that was taken out on this home.Purchase Details
Purchase Details
Home Values in the Area
Average Home Value in this Area
Purchase History
We collect this data history from publicly available records. To have your information removed, we recommend requesting removal directly through your county’s website.
| Date | Buyer | Sale Price | Title Company |
|---|---|---|---|
| -- | Integrated Title Ins Svcs | ||
| -- | First American Title | ||
| -- | First American Title Company | ||
| -- | First American Title Company | ||
| -- | Integrated Title Ins Service | ||
| -- | Accommodation | ||
| -- | Accommodation | ||
| -- | Premier Title Ins Agency | ||
| -- | -- | ||
| -- | -- | ||
| -- | -- |
Mortgage History
We collect this data history from publicly available records. To have your information removed, we recommend requesting removal directly through your county’s website.
| Date | Status | Borrower | Loan Amount |
|---|---|---|---|
| Open | $380,000 | ||
| Previous Owner | $180,000 | ||
| Previous Owner | $184,594 | ||
| Previous Owner | $157,529 | ||
| Previous Owner | $132,000 |
Tax History
We collect this data history from publicly available records. To have your information removed, we recommend requesting removal directly through your county’s website.
| Year | Tax Paid | Tax Assessment Tax Assessment Total Assessment is a certain percentage of the fair market value that is determined by local assessors to be the total taxable value of land and additions on the property. | Land | Improvement |
|---|---|---|---|---|
| 2025 | $2,797 | $532,200 | $163,200 | $369,000 |
| 2024 | $2,816 | $533,600 | $157,000 | $376,600 |
| 2023 | $2,775 | $525,400 | $149,200 | $376,200 |
| 2022 | $2,857 | $532,100 | $146,300 | $385,800 |
| 2021 | $977 | $359,700 | $113,700 | $246,000 |
| 2020 | $250 | $327,400 | $113,700 | $213,700 |
| 2019 | $308 | $308,300 | $107,300 | $201,000 |
| 2018 | $223 | $296,000 | $107,300 | $188,700 |
| 2017 | $413 | $266,400 | $107,300 | $159,100 |
| 2016 | $715 | $256,300 | $107,300 | $149,000 |
| 2015 | $1,564 | $205,600 | $129,100 | $76,500 |
| 2014 | -- | $185,600 | $118,200 | $67,400 |
Map
- 1176 E Cottonwood Hills Dr
- 8109 S Cottonwood Hills Cir
- 8101 S Cottonwood Hills Cir
- 8373 S 1100 E Unit 39
- 8054 S Boysenberry Dr
- 8527 Colene Dr
- 8158 S Andorra Ln
- 8555 S Grambling Way
- 944 E Bernay Cir
- 8022 S Peregrine Place
- 1206 E Moss Cir
- 1342 E Sudbury Ave
- 8492 S Mesa Dr
- 1341 E Creek Rd
- 1575 E 8600 S
- 8651 S Harvard Park Dr
- 1430 E 8685 S
- 8268 S 865 E
- 7795 S 1000 E
- 8643 Vaquero Dr
- 1255 E 8220 S
- 1263 E 8220 S
- 1245 E 8220 S
- 1260 E 8220 S
- 8210 S 1280 E
- 1237 E 8220 S
- 1242 E 8220 S
- 1272 E 8220 S
- 8241 S Shangrila Cir
- 8241 Shangrila Cir
- 8231 S 1225 E
- 8242 Shangrila Cir
- 8244 S 1280 E
- 8207 S 1280 E
- 8219 S 1280 E
- 8186 S 1300 E
- 8245 S 1225 E
- 1215 E 8220 S
- 1219 E 8220 S
- 1206 Cottonwood Hills Dr
Ask me questions while you tour the home.