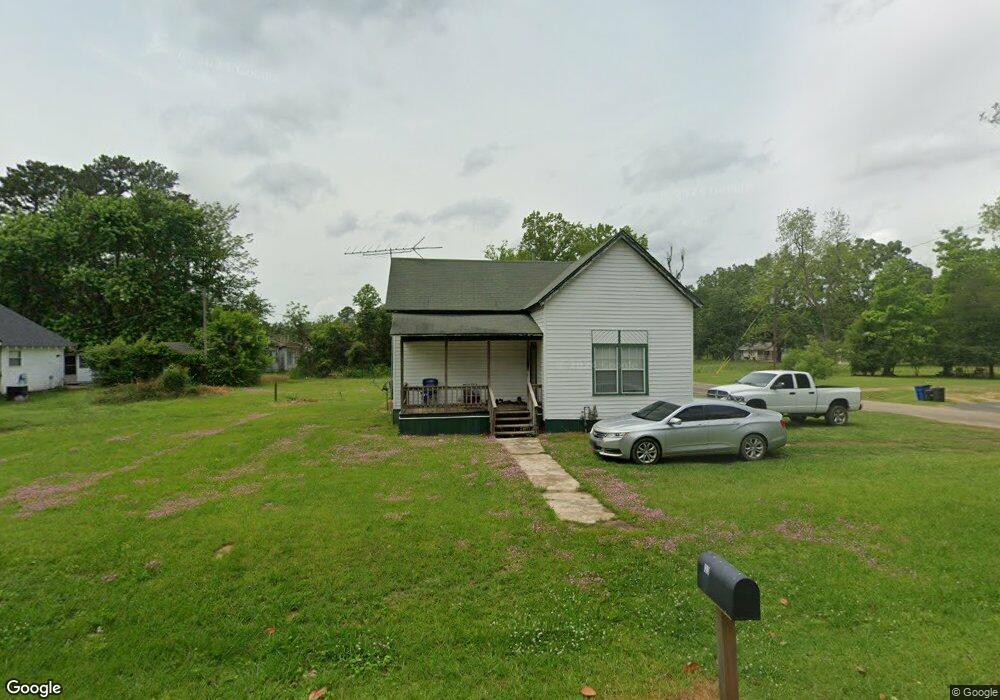
123 Pullman St Bradley, AR 71826
Estimated Value: $66,169 - $139,000
Studio
--
Bath
1,344
Sq Ft
$71/Sq Ft
Est. Value
About This Home
This home is located at 123 Pullman St, Bradley, AR 71826 and is currently estimated at $95,292, approximately $70 per square foot. 123 Pullman St is a home with nearby schools including Bradley Elementary School and Bradley High School.
Ownership History
Date
Name
Owned For
Owner Type
Purchase Details
Closed on
Oct 31, 2022
Sold by
Baker Jessica
Bought by
Briggs Dekendrick
Current Estimated Value
Purchase Details
Closed on
Jun 30, 2016
Sold by
Wells Fargo Bank Na Trustee For Rivervie
Bought by
Baker Jessica
Purchase Details
Closed on
Dec 29, 2014
Bought by
Wells Fargo Bank Na As and Trustee For Riverview Mortgage
Purchase Details
Closed on
Apr 7, 2004
Bought by
Postelwait Audrey and Dennis Dean
Purchase Details
Closed on
Feb 3, 1999
Bought by
Postelwait David and Postelwait Audrey
Purchase Details
Closed on
Jan 1, 1967
Bought by
Denham Larry Leon and Denham P
Create a Home Valuation Report for This Property
The Home Valuation Report is an in-depth analysis detailing your home's value as well as a comparison with similar homes in the area
Purchase History
| Date | Buyer | Sale Price | Title Company |
|---|---|---|---|
| Briggs Dekendrick | $600 | None Listed On Document | |
| Baker Jessica | $10,500 | -- | |
| Wells Fargo Bank Na As | -- | -- | |
| Postelwait Audrey | -- | -- | |
| Postelwait David | $9,000 | -- | |
| Denham Larry Leon | -- | -- |
Source: Public Records
Tax History
| Year | Tax Paid | Tax Assessment Tax Assessment Total Assessment is a certain percentage of the fair market value that is determined by local assessors to be the total taxable value of land and additions on the property. | Land | Improvement |
|---|---|---|---|---|
| 2025 | $337 | $6,560 | $390 | $6,170 |
| 2024 | -- | $6,560 | $390 | $6,170 |
| 2023 | $0 | $6,330 | $370 | $5,960 |
| 2022 | $0 | $6,330 | $370 | $5,960 |
| 2021 | $0 | $6,330 | $370 | $5,960 |
| 2020 | $0 | $6,330 | $370 | $5,960 |
| 2019 | $347 | $6,330 | $370 | $5,960 |
| 2018 | $0 | $6,760 | $550 | $6,210 |
| 2017 | $347 | $6,760 | $550 | $6,210 |
| 2016 | $347 | $6,760 | $550 | $6,210 |
| 2015 | $347 | $6,760 | $550 | $6,210 |
| 2014 | -- | $3,641 | $400 | $3,241 |
Source: Public Records
Map
Nearby Homes
- 1448 Lafayette 9
- Beaver Road Doe Road Area
- 000 Kingfisher Dr
- 000 Whippoorwill Dr
- County Rd 286
- 179 Lafayette 293
- 13 Eagle Point Dr
- Lots 23 & 24 Eagle Brook Dr
- Lot 1 Lafayette 74
- 0 Eagle Brook Dr Unit 21220390
- Lot 3 Eagle Brook Dr
- Lot 4 Eagle Brook Dr
- Lot 2 Lafayette 74
- 32 Eagle View S
- 151 Eagle View Dr
Your Personal Tour Guide
Ask me questions while you tour the home.