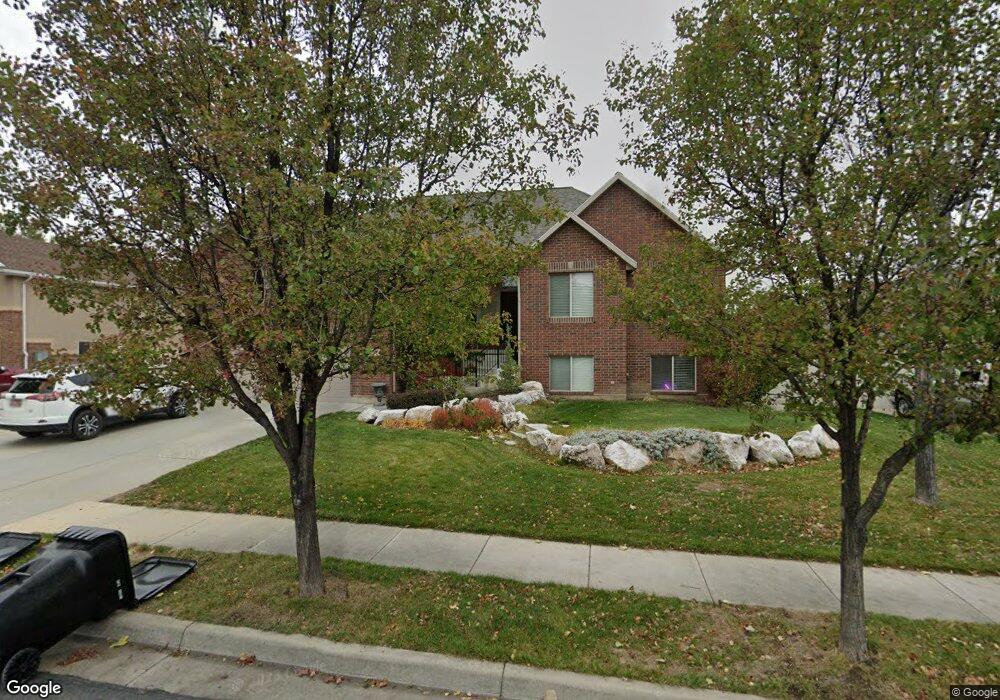
1237 N 640 W West Bountiful, UT 84087
Estimated Value: $635,000 - $812,000
5
Beds
3
Baths
2,390
Sq Ft
$311/Sq Ft
Est. Value
About This Home
This home is located at 1237 N 640 W, West Bountiful, UT 84087 and is currently estimated at $742,973, approximately $310 per square foot. 1237 N 640 W is a home located in Davis County with nearby schools including West Bountiful Elementary School, Bountiful Junior High School, and Viewmont High School.
Ownership History
Date
Name
Owned For
Owner Type
Purchase Details
Closed on
Jul 22, 2011
Sold by
Howe Jerry Dean and Howe Kristin Louise
Bought by
Howe Jerry Dean and Howe Kristin Louise
Current Estimated Value
Home Financials for this Owner
Home Financials are based on the most recent Mortgage that was taken out on this home.
Original Mortgage
$154,000
Outstanding Balance
$11,513
Interest Rate
4.46%
Mortgage Type
New Conventional
Estimated Equity
$731,460
Purchase Details
Closed on
May 13, 2004
Sold by
Triples Development Inc
Bought by
Howe Jerry Dean and Howe Kristin Louise
Create a Home Valuation Report for This Property
The Home Valuation Report is an in-depth analysis detailing your home's value as well as a comparison with similar homes in the area
Home Values in the Area
Average Home Value in this Area
Purchase History
| Date | Buyer | Sale Price | Title Company |
|---|---|---|---|
| Howe Jerry Dean | -- | First American Title | |
| Howe Jerry Dean | -- | Equity Title Agency |
Source: Public Records
Mortgage History
| Date | Status | Borrower | Loan Amount |
|---|---|---|---|
| Open | Howe Jerry Dean | $154,000 |
Source: Public Records
Tax History
| Year | Tax Paid | Tax Assessment Tax Assessment Total Assessment is a certain percentage of the fair market value that is determined by local assessors to be the total taxable value of land and additions on the property. | Land | Improvement |
|---|---|---|---|---|
| 2025 | $4,418 | $385,550 | $156,962 | $228,588 |
| 2024 | $4,136 | $369,050 | $129,579 | $239,471 |
| 2023 | $4,320 | $710,000 | $241,543 | $468,457 |
| 2022 | $4,408 | $405,351 | $118,718 | $286,633 |
| 2021 | $4,142 | $585,000 | $165,596 | $419,404 |
| 2020 | $3,732 | $521,000 | $149,360 | $371,640 |
| 2019 | $3,675 | $507,000 | $147,376 | $359,624 |
| 2018 | $3,571 | $485,000 | $142,598 | $342,402 |
| 2016 | $2,786 | $203,500 | $42,294 | $161,206 |
| 2015 | $2,981 | $207,350 | $42,294 | $165,056 |
| 2014 | $3,008 | $214,917 | $42,294 | $172,623 |
| 2013 | -- | $174,218 | $51,815 | $122,403 |
Source: Public Records
Map
Nearby Homes
- 1520 N 550 W
- 366 W 1000 N
- 1503 N 300 W
- 1625 Pages Place
- 235 W 1400 N
- 328 W Pages Ln
- 591 W 2050 N
- 1130 N 200 W
- 1260 N 200 W
- 563 N 200 W
- 403 W 400 N Unit 1
- 401 W 400 N Unit 49
- 290 N 500 W Unit 108
- 290 N 500 W Unit 305
- 499 N 200 W Unit 19
- 204 Lyman Ln
- 1084 W Audrey Ln
- 988 W 1950 N Unit 134
- 332 N 300 W
- 449 W 200 N Unit 3
Your Personal Tour Guide
Ask me questions while you tour the home.